ALMaSS can simulate a range of species and landscapes (having national coverage in some countries). It is therefore possible to use this to test policy scenarios on a large scale. The ALMaSS skylark model has previously been used to evaluate taxation policies in Denmark but ALMaSS was more recently used to support the Dutch government's evaluation of their sustainable agriculture policy by running various pesticide scenarios see pdf.
These scenarios concluded that for skylarks it was likely to be proximate factors other than pesticides that were driving abundance (although indirect of pesticides over a long period reducing insect abundance in general could not be ruled out). Mitigation strategies for pesticides did however increase hare densities, but the effect was landscape context dependent. For beetles the toxicity of the pesticides was critical and mattered more than mitigation, with spray drift reducing nozzles being of little benefit compared to the current situation.
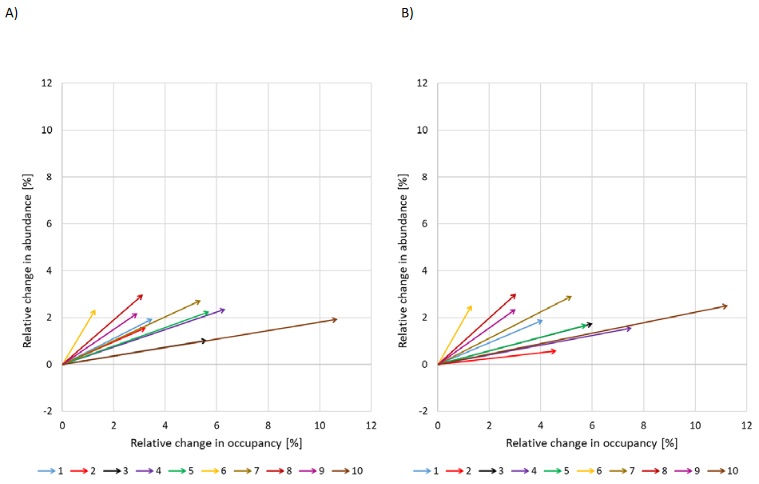
The graphs above show change in abundance relative to baselines for 10 landscapes for beetles assuming that field margins extensions were introduced under conditions where pesticides were assumed to have long (25 days) half-life, or short < 2 days. For most situations this had no effect suggesting that knock-down effects were more important than long-term impacts, probably due to the fact that the intensive agricultural areas effectively excluded these beetles from breeding in the fields.
This example comes from Topping et al (2019), and shows how it is possible to combine species x landscape x management with costings and management goals for each species. The study used 10 landscapes from different parts of Denmark and hares, skylarks and beetles each with species-specific management goals (e.g. hares >7 female per square km).
The graph below shows the number of adult females for the three species considered in the analysis assuming we do not change management for 10 different landscapes in Denmark (x-axis). 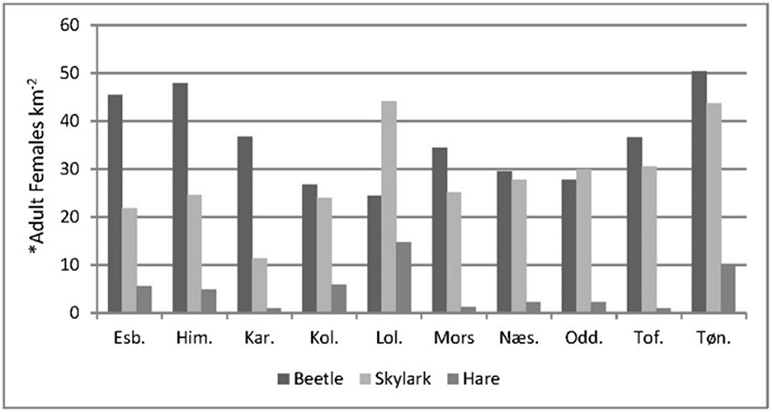
What is clear is that the starting densities of animals varies between landscape per species and within landscapes across species. There is no clear pattern. Hence, the baseline context varies and affects the ease of achieving fixed goals e.g. no female hares per unit area.
The diagram below shows what happens when we combine various potential managements (colour-coded for cost) with the landscapes and species. Coloured squares indicate that for that species combination we have achieved the management goals using that management on the landscape represented by the column.
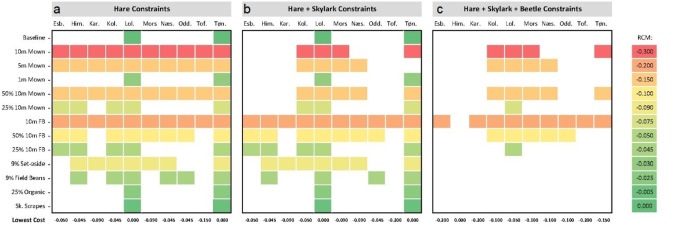
The managements tested are mostly field margin managements and when only considering hares (a) for all landscapes there are multiple options. As we add new management constraints for skylarks and beetles the options decrease and the cost increases. In one landscape (Him) it was not possible to satisfy all the management goals using these managements individually.
Although relatively simple this example shows how we can develop multiple scenarios to test management or policy to enable decision making based on multiple criteria. For a real case we would of course consider many more combinations of managements to gain a fuller picture of the ease of achieving management goals.
