Impact assessment using ALMaSS can be relatively straight forward. For example in the map below we have a proposed change of management as a result of a ground water protection scheme (pink & red areas). These changes result in local changes in population size of the species modelled (white circles means population decrease, black circles means population increase):
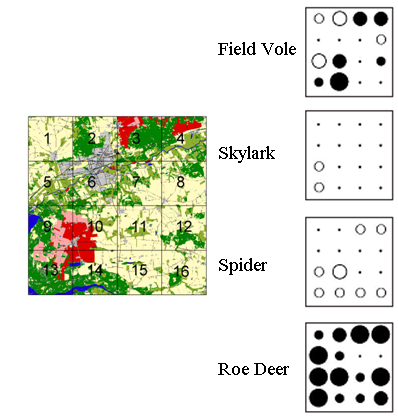
Results show a spatial response by the animal populations. It is worth noting that responses also vary between species, and that within species can be both positive and negative depending on local conditions.
In this case the assessment was as simple as making a change to the map used as input to the model. In other cases changes can be made to the way in which we manage crops, climate, or infrastructure. Changes may also have a temporal component e.g. temporary bans on pesticides.
