Health Risk Maps
Large differences in health risks due to air pollution in Europe
A newly developed easy-to-understand map of health risk of air pollution in Europe shows huge differences among areas. The highest health risks of premature deaths and morbidity caused by air pollution are found especially in parts of Eastern Europe and Northern Italy, while the lowest risks are found in Northern Europe, according to data from the MARCHES’s study.
Health risk maps may be used to inform the public about differences in health risks among areas and can also help policymakers in support of air quality policies that address these inequalities.
Air pollution is currently the major environmental health risk in Europe, contributing to more than 400,000 premature deaths annually according to the European Environment Agency (EEA).
Air pollution is a major health risk
The number of premature deaths related to air pollution has decreased in recent decades, especially due to EU regulation of emissions from sectors such as road transport and the implementation of national emission ceilings. National efforts to reduce emissions have also contributed to improvements in air quality. The number of premature deaths caused by air pollution is expected to decrease further in the future due to continued EU and national regulation of emissions. However, air pollution is expected to remain a substantial environmental health risk in Europe in the coming years.
Health risk maps is a way to illustrate the health impacts of air pollution, illustrating how the health risk is in each country and region compared to others.
Therefore, as part of the MARCHES project, there have been developed spatial health risk maps for Europe that aim to make such differences in health risks easier for citizens and policymakers to understand. The map provides easy-to-understand geographic indicators illustrating how health risks associated with air pollution vary between different areas.
EVA and DALY
The risk map is based on the model EVA (Economic Valuation of Air pollution) which is used to calculate the health effects of air pollution. The EVA model system integrates air pollution data from atmospheric models with population data to estimate human exposures. It then uses formulas that link pollution exposure to health risks and finally, these health impacts are monetised using valuation methods.
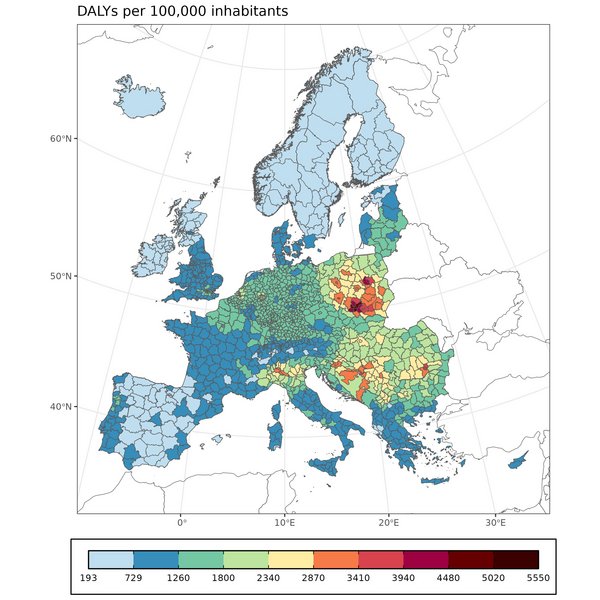
The health risk indicator used in the map is DALY (disability-adjusted life year). DALY combines both premature mortality and morbidity and thereby shows the total health burden, measured in DALYs per 100,000 inhabitants. One DALY represents the loss of the equivalent of one year of full health. DALYs for a disease or health condition are the sum of years of life lost due to premature mortality (YLLs) and the years of healthy life lost due to disability (YLDs). Different health conditions have different impacts on quality of life. For example, asthma is estimated to reduce quality of life by around 4.5%, while cancer has a much greater impact, estimated at around 26.5%. To illustrate how this is reflected in DALYs, four years lived with cancer would correspond to approximately one year of healthy life lost (one DALY). Premature mortality accounts for the largest share of the total estimated DALYs in Europe, contributing approximately 70%, while morbidity contributes approximately 30%.
Fine particulate matter
Our findings show that almost all premature deaths and morbidity outcomes estimated by the EVA model system are related to fine particulate matter PM2.5.
The spatial distribution of the total premature deaths and morbidity cases therefore depends primarily on the spatial distribution of PM2.5 concentrations and the population density, shown in Figure 1.
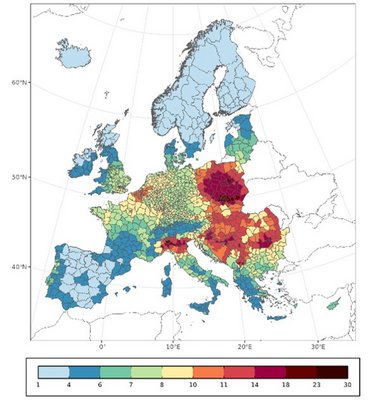
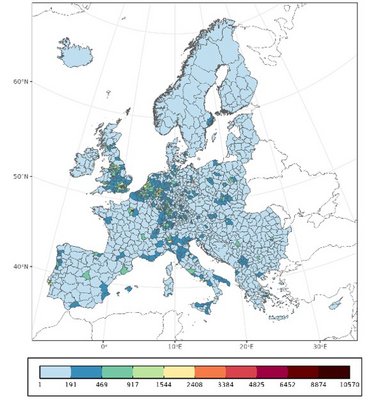
As a result of this, Figure 2 shows DALYs per 100,000 inhabitants by administrative region in Europe. Figure 2 shows how some countries and regions are much more negatively impacted by air pollution than others. The spatial distribution of DALYs per 100,000 inhabitants largely follows the spatial distribution of PM2.5 concentrations, as PM2.5 is the main contributor to the estimated health burden.
Differences in health risks
However, DALYs can be difficult for non-experts to interpret. In the MARCHES project, we therefore developed and assessed easy-to-understand indicator with index ranges from 0% to 100%, with 100% representing the area in Europe with the highest health burden and 0% the lowest health burden, expressed in DALYs per 100,000 inhabitants. The indicator illustrates the relative differences in health risks between countries and regions and is shown in Figure 3.
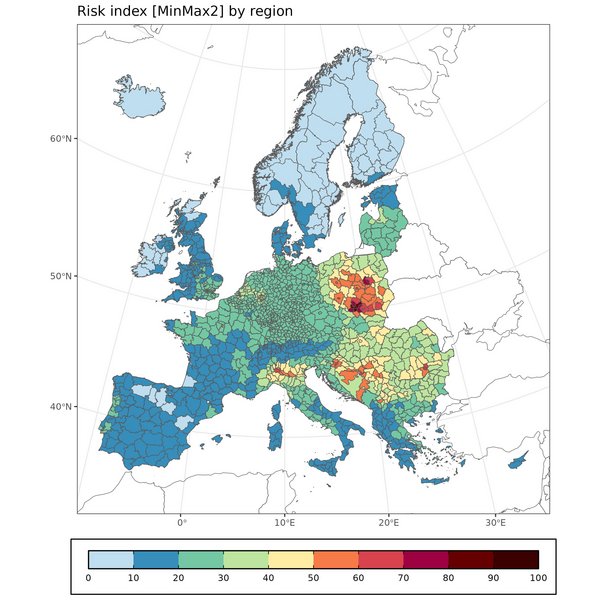
The figure shows that the highest health risks are found particularly in parts of Eastern Europe and Northern Italy. The lowest risks are found in Northern Europe.
Recommendations
Health risk index ranging of areas may be a suitable way to communicate relative differences in health risks to non-experts using disability-adjusted life year (DALY) metric as an indicator for health risks.
Therefore, European member States may consider developing detailed health risk maps for air pollution at the scale down to a few kilometres, to inform the public on a website about the regional differences in air-pollution-related health burdens, and between urban and rural areas.
Health risk maps may also support policymakers in the identification of geographical inequalities in health risk of different areas in support of air quality policies that address these inequalities.
Further information is available as a policy brief on the health risk maps of air pollution in Europe, see https://projects.au.dk/marches/policy-briefs/policy-briefs.