Odense Fjord Catchment
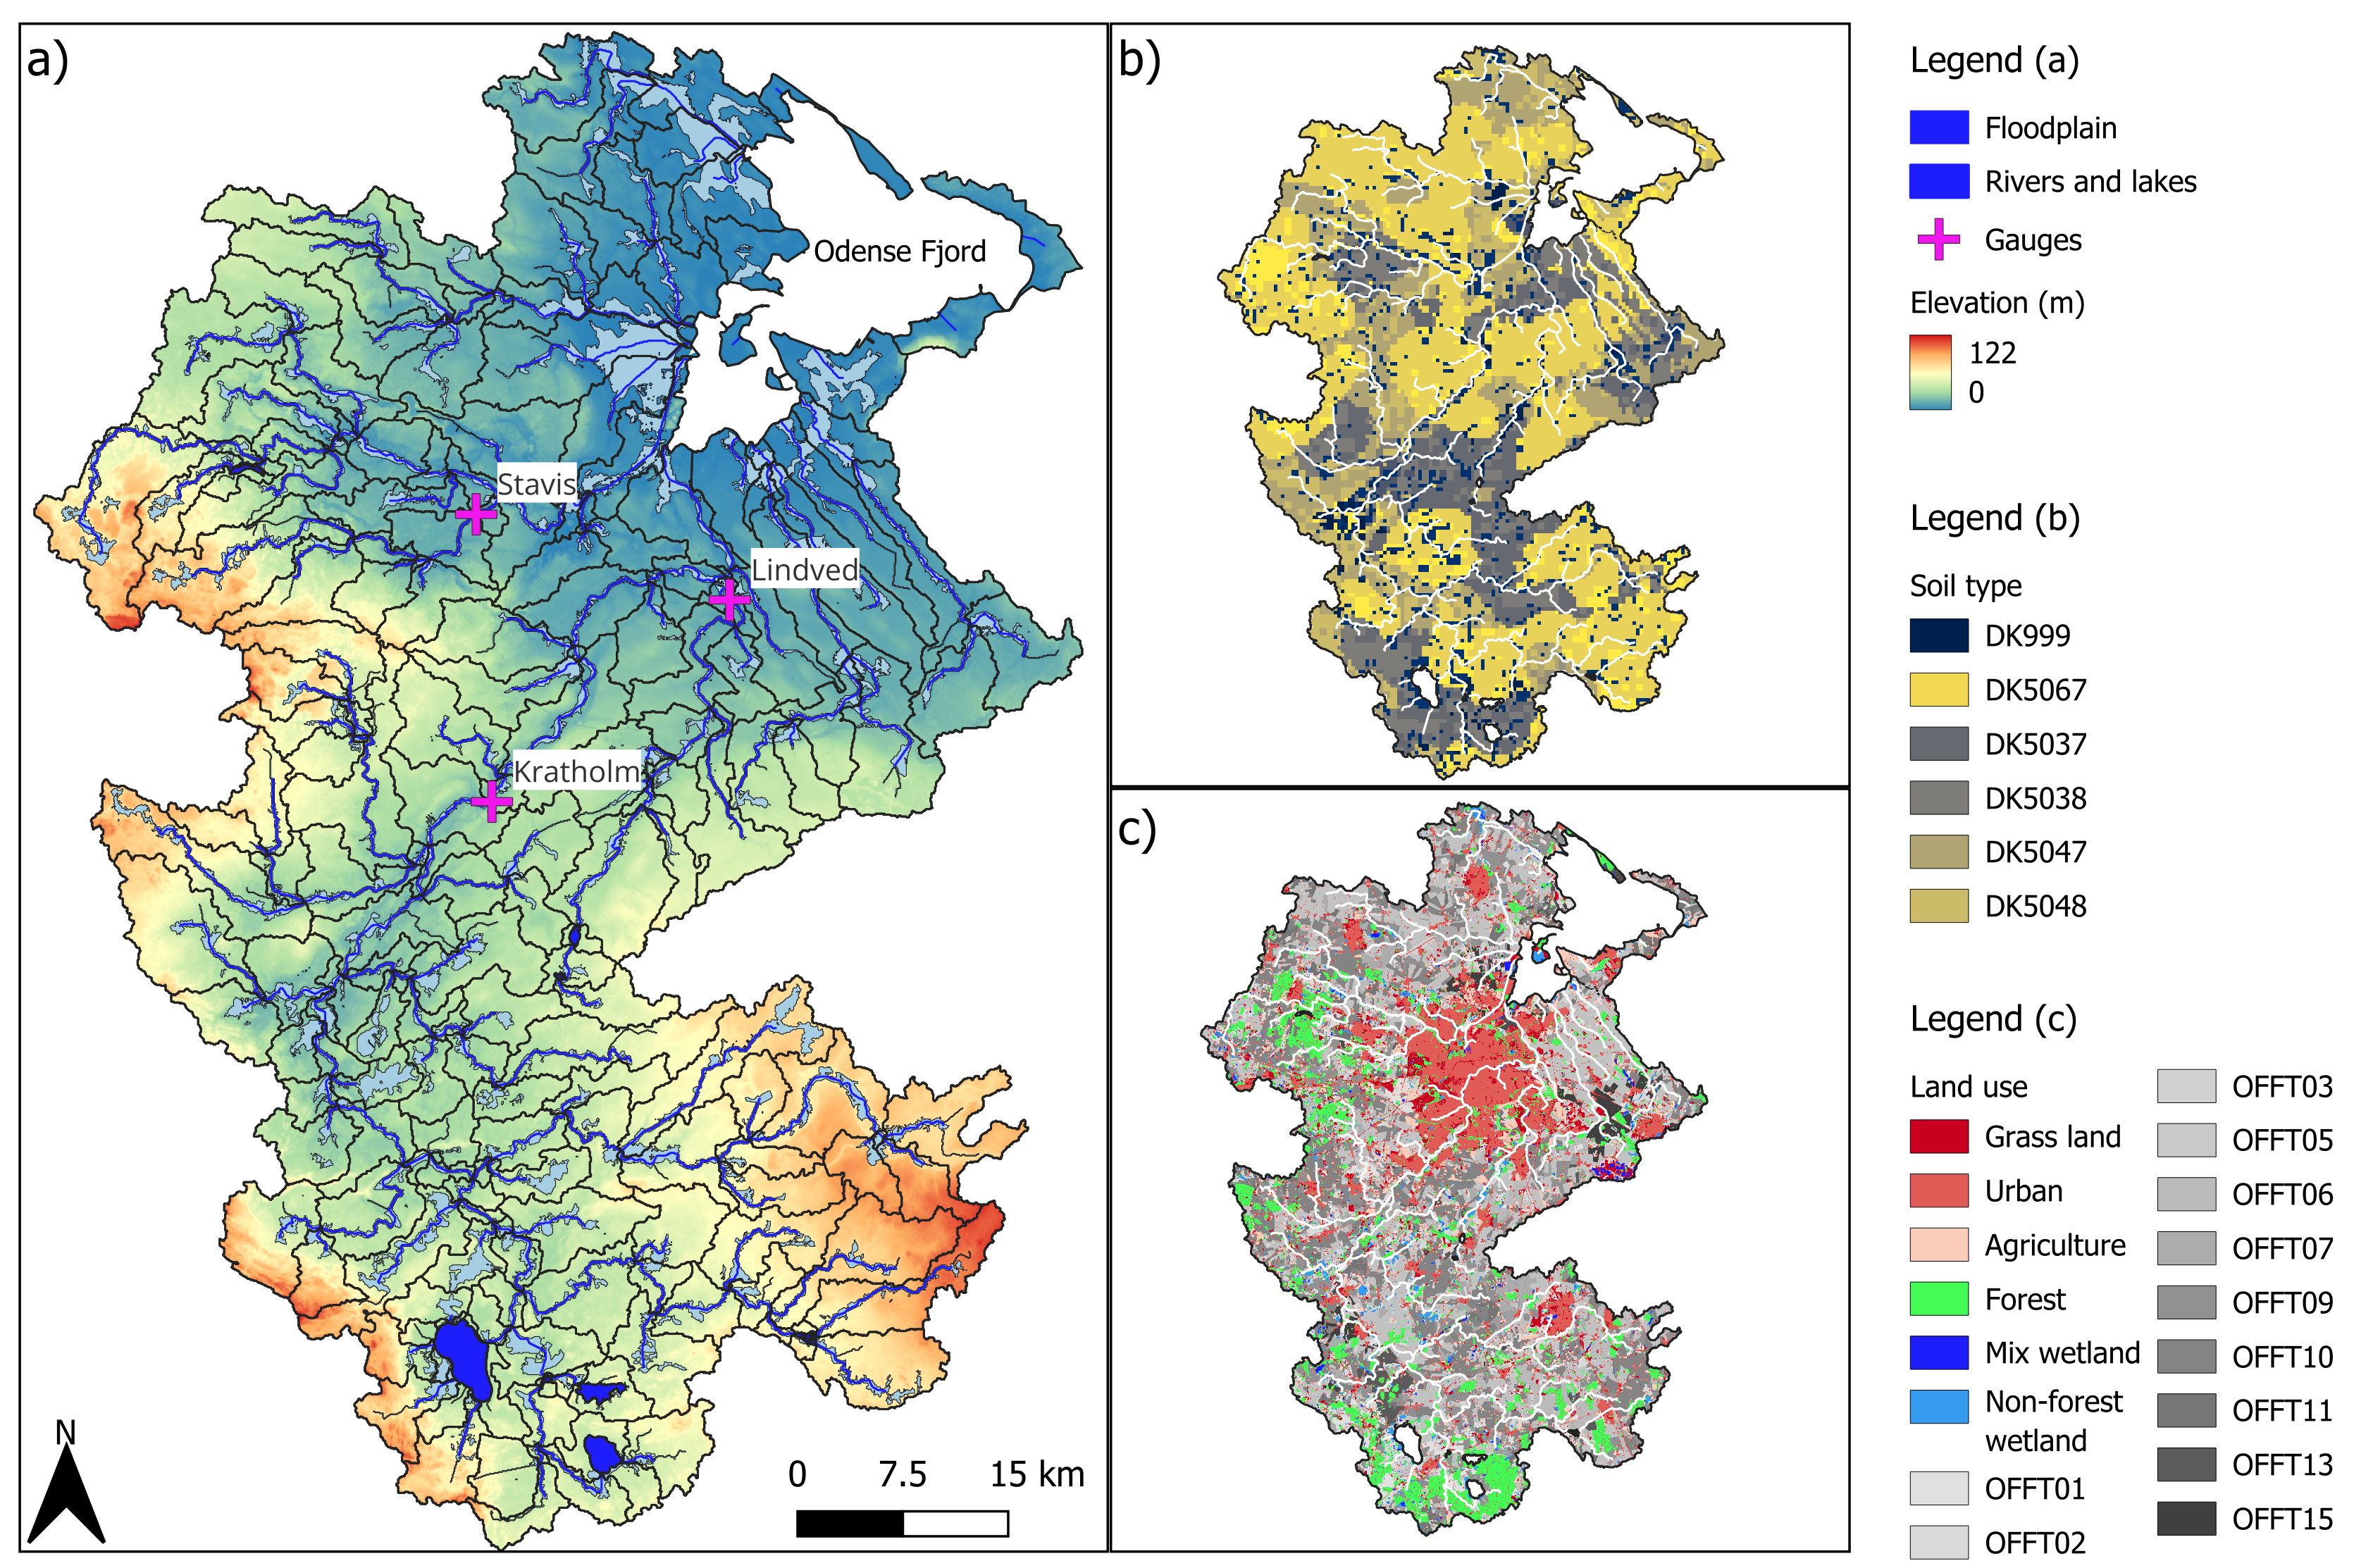
The 1061 km² Odense Fjord Catchment is located on the Island of Funen in Denmark.
- Geomorphology is characterized by younger clayey moraines from the Weichsel glaciation.
- Dominated by agricultural land use (68% of the area).
- Approximately 80% of the agricultural land is tile-drained.
- Urban areas (City of Odense) and forests cover 16% and 10% of the catchment area, respectively.
- The average annual precipitation is 825 mm, and the mean temperature is 8.4 °C.
Baseline model
Model setup
Code/software versions used
Code | Version number | Availability |
QGIS | 3.22.16 | QGIS used as a basis for running the QSWAT+ plugin. In this project, the latest stable release was used, which is the version that QSWAT+ aims to be compatible with. This can be downloaded from:https://qgis.org/downloads |
SWAT+ (core model) | 2025.61.0.2.11-104-gfcb8738 | The SWAT+ Fortran code is version controlled through bitbucket. Official code releases are available here: https://bitbucket.org/blacklandgrasslandmodels/modular_swatplus/src/master/ |
QSWAT+ (interface) | 2.4.1 | Code and official installer releases are available here: https://bitbucket.org/ChrisWGeorge/qswatplus3/downloads |
SWAT+ Editor (interface) | 2.3.1 | Code and official installer releases are available here: https://bitbucket.org/swatplus/swatplus.editor/downloads/ |
SWATdoctR (model setup verification) | 1.0 | R package for SWAT+ model calibration and model diagnostics. |
SWATrunR calibration tool | 0.1.3> | R-package developed for hard calibration of the SWAT+ model. |
Catchment delineation
| Channel threshold: | 3 km2 |
| Stream threshold: | 3 km2 |
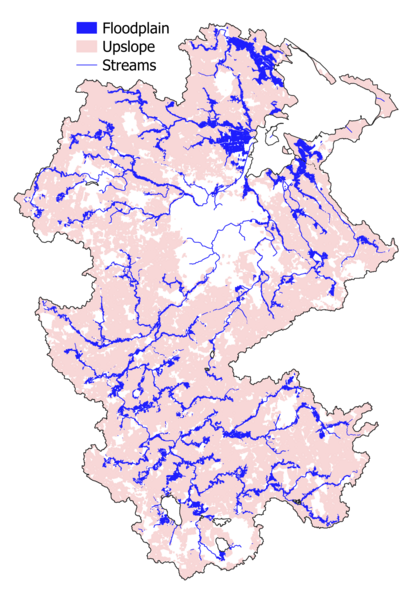
| Upslope/Floodplain LSUs: | Branch Length Method with a Slope Position Threshold of 0.1 |
| Lakes: | Shapefile with lakes > 5 ha |
To include areas that drain directly to coastal waters in the model setup, the landscape units delineated by QSWAT+ based on the DEM and stream network were edited manually in QGIS and subsequently loaded into the interface as a pre-defined catchment.
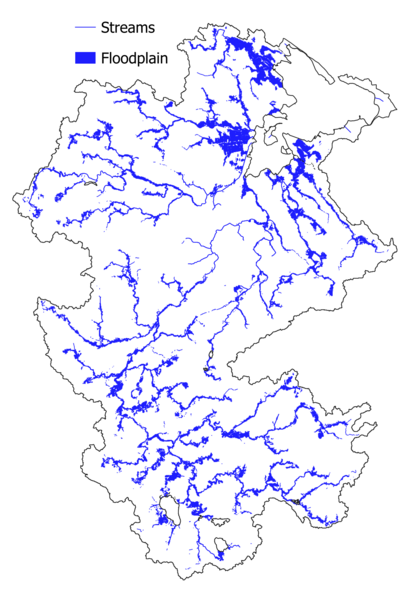
The delineated floodplains were compared to the river valley bottom map by Sechu et al. (2021) and a map of lowland soils in Denmark.
Some lakes were not located on the stream network and thus excluded from the setup by QSWAT+.
HRU creation
| Land use: | Customized land use map created by combining the general DK land use map and a field boundary map from 2020 |
| Soil: | National Topsoil Texture Map |
| Slope classes: | 0-9999% |
| HRU filtering: | none |
Final configuration
| Total watershed area: | 1.053 km2 |
| Subbasins and channels: | 213 |
| LSUs: | 420 (including both upslope and floodplain LSUs) |
| Number of lakes: | 8 |
Point sources
Recall files with flow data were added for the 10 largest wastewater treatment plants. Each point source was connected to its nearest channel.
Other changes to the model setup and parameterization
Some of the default values used by the SWAT+ Editor did not reflect the specific characteristics of the Odense Fjord Catchment, so several input files were edited manually before model calibration:
- Subsurface tile drains were implemented in all agricultural HRUs with a mean slope of less than 5%, which resulted in approximately 80% of the agricultural land in the catchment being tile-drained.
- The values of three parameters that control the runoff and leaching potential of the HRUs (perco, cn3_swf, latq_co) were edited based on recommendations from the model development team.
- Management schedules were implemented to define agricultural management operations (sowing, harvest, fertilizer and manure applications, and tillage) for the different crop rotations implemented in the model.
- An outlet object was added to the model setup, which summarizes the discharge and nutrient loads from all streams draining into Odense Fjord.
More information about the model setup can be found here: https://projects.au.dk/nordbalt-ecosafe/deliverables
Calibration and validation
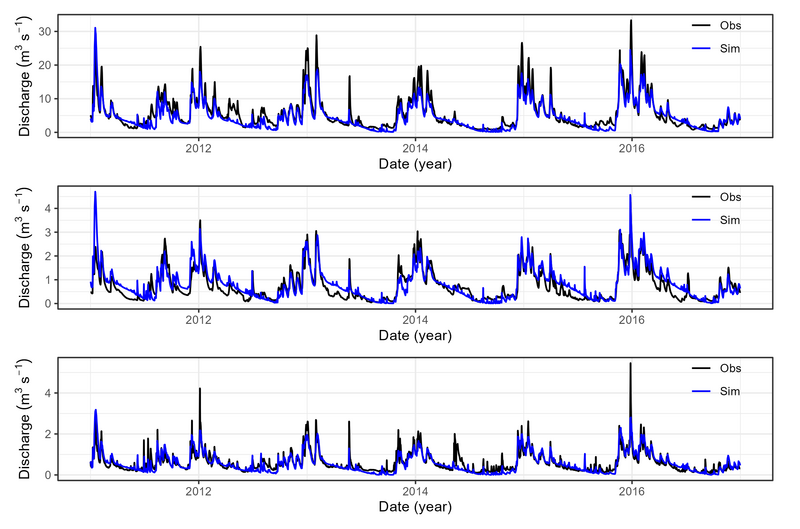
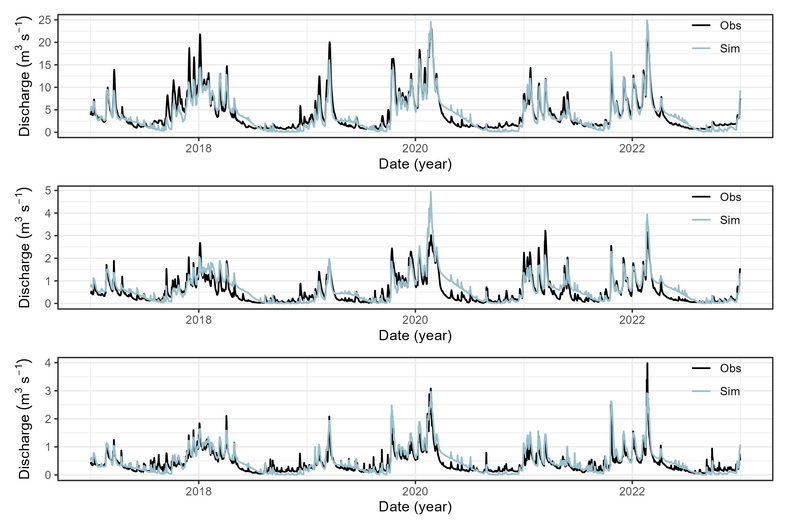
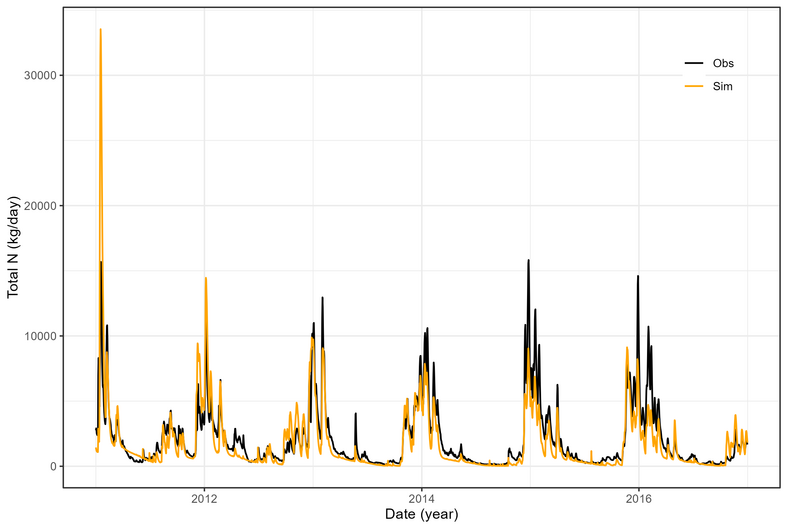
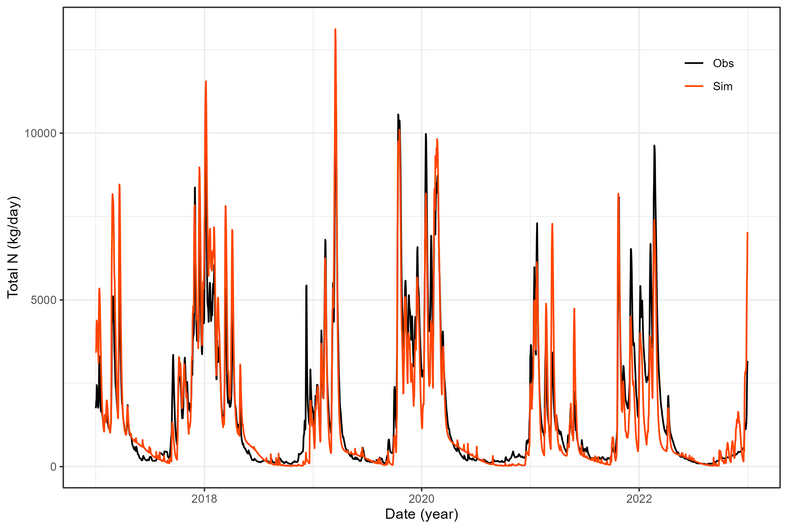
The calibration and validation of daily discharge and total nitrogen was performed at three gauges for streamflow and one gauge for total nitrogen: Odense Å at Kratholm (discharge and total nitrogen), Stavis Å (discharge), and Lindved Å (discharge).
- Model warm-up: 1/1/2008 – 31/12/2010
- Calibration: 1/1/2011 – 31/12/2016
- Validation: 1/1/2017 – 31/12/2022
Model evaluation statistics for daily discharge during the calibration (Cal) and validation (Val) periods
| Gauge | KGE | Pbias | NSE | |||
| Cal | Val | Cal | Val | Cal | Val | |
| Odense Å at Kratholm | 0.77 | 0.99 | -15.7 | -6.7 | 0.81 | 0.86 |
| Stavis Å | 0.83 | 0.77 | 11.1 | 17.7 | 0.73 | 0.69 |
| Lindved | 0.86 | 0.74 | -4.2 | 11.9 | 0.73 | 0.71 |
Model evaluation statistics for daily nitrogen loads during the calibration (Cal) and validation (Val) periods
| Gauge | KGE | Pbias | NSE | |||
| Cal | Val | Cal | Val | Cal | Val | |
| Odense Å at Kratholm | 0.75 | 0.90 | -14.9 | -4.1 | 0.58 | 0.83 |
More information about the model setup can be found here: https://projects.au.dk/nordbalt-ecosafe/deliverables
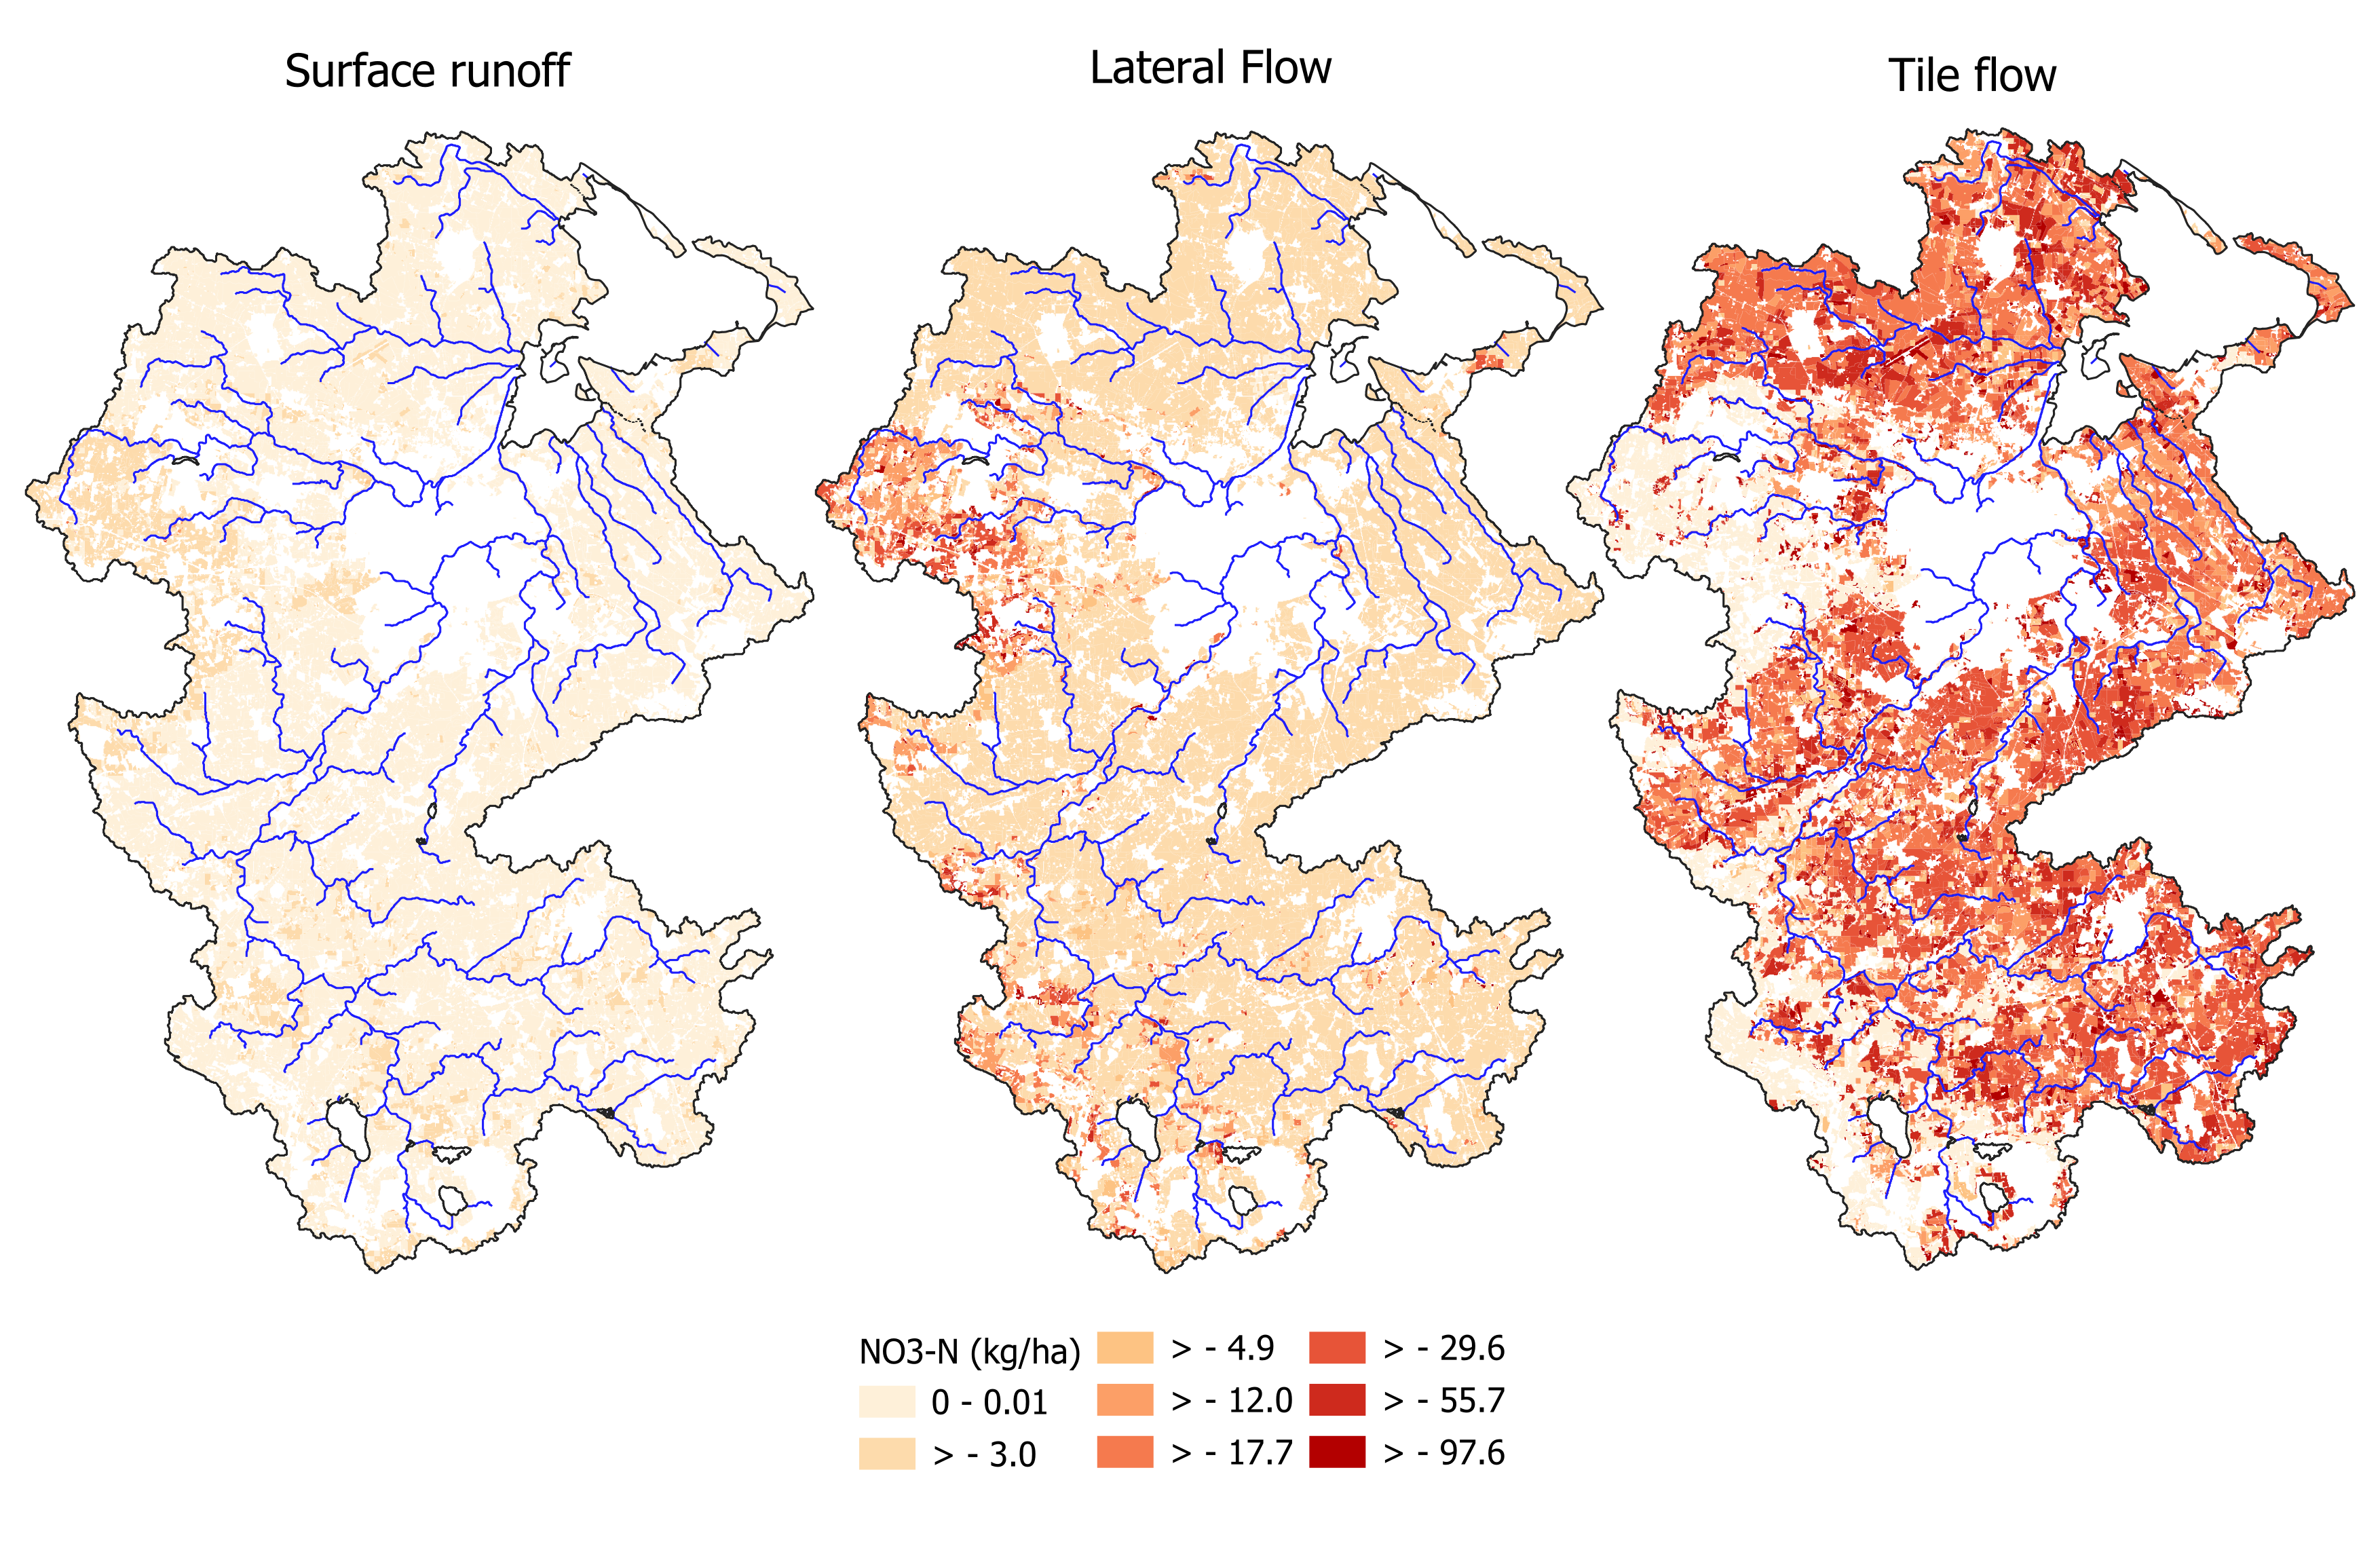
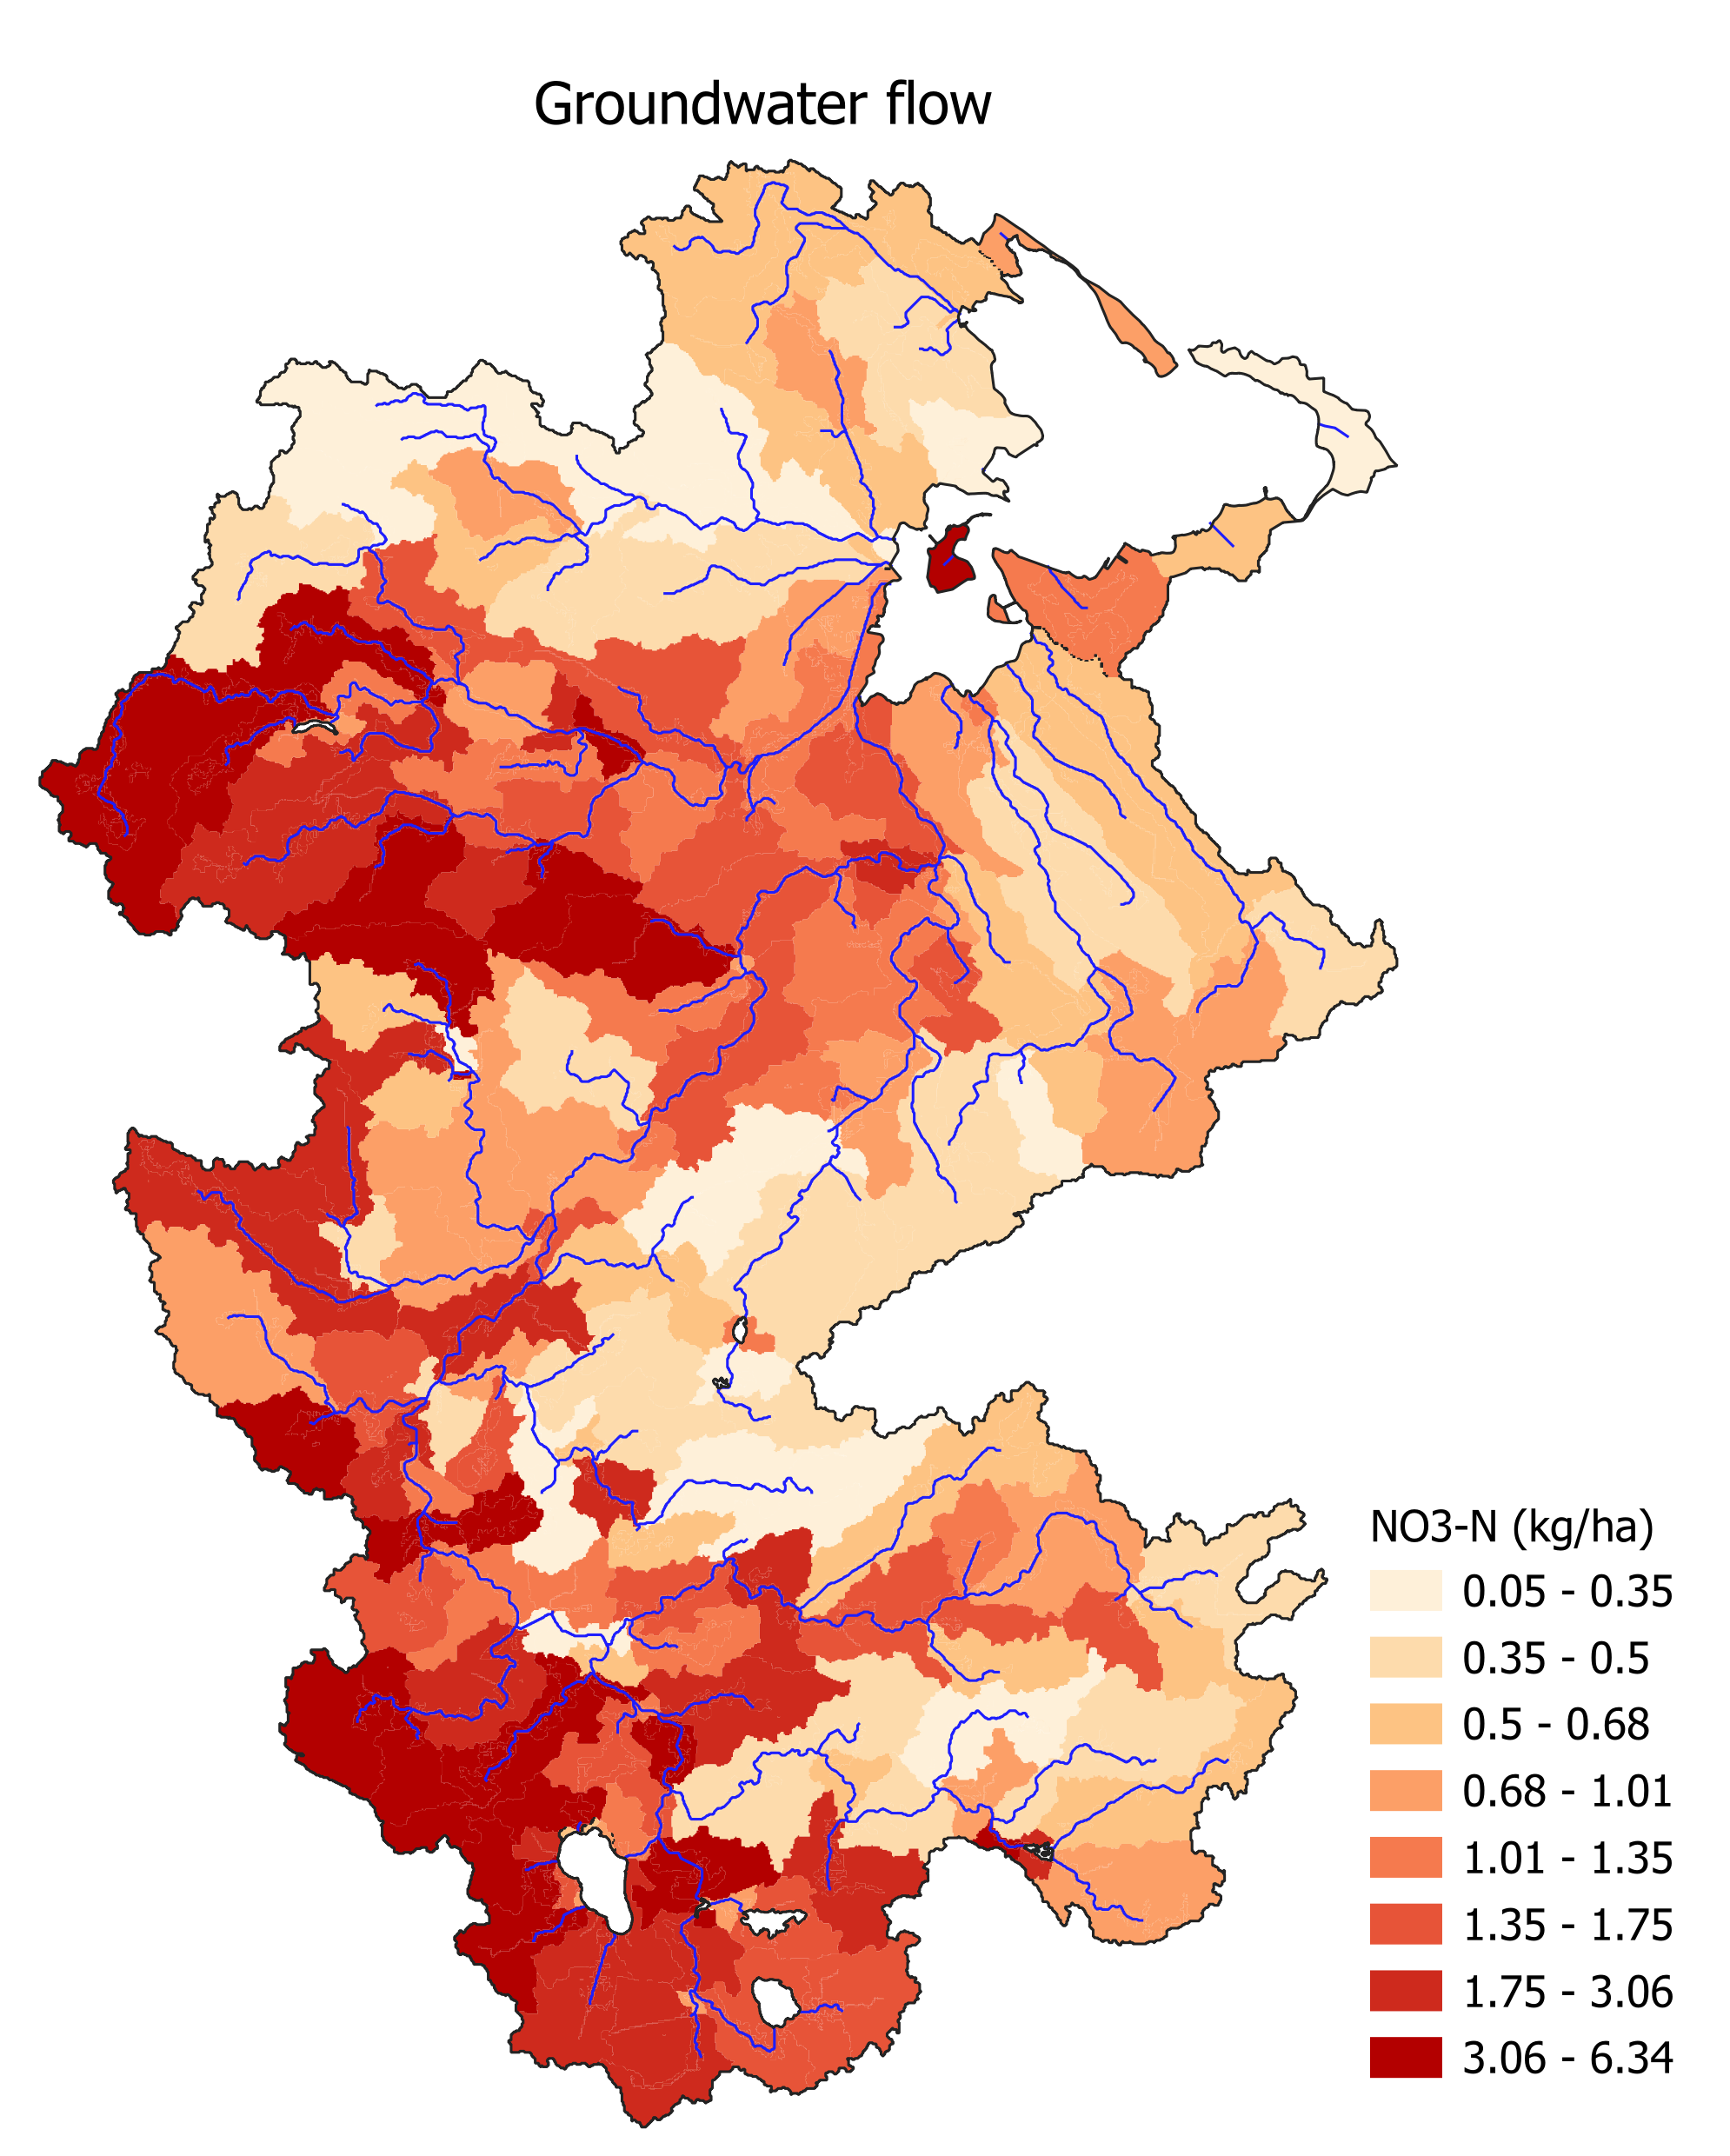
Critical source areas
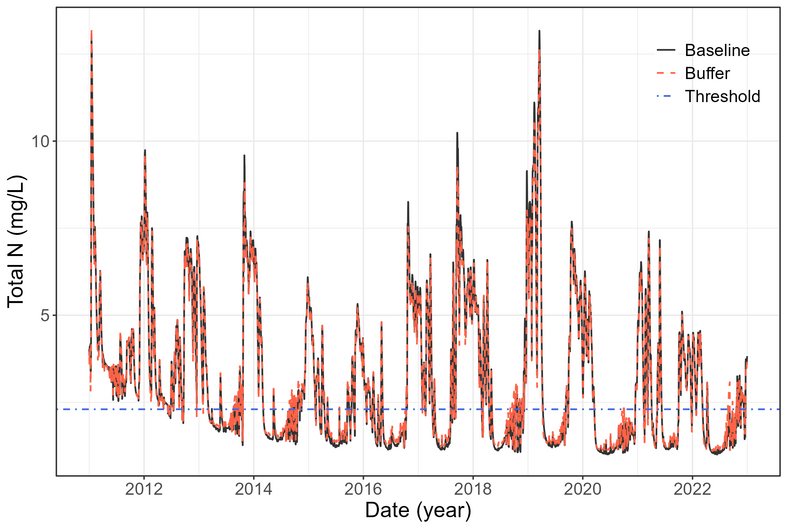
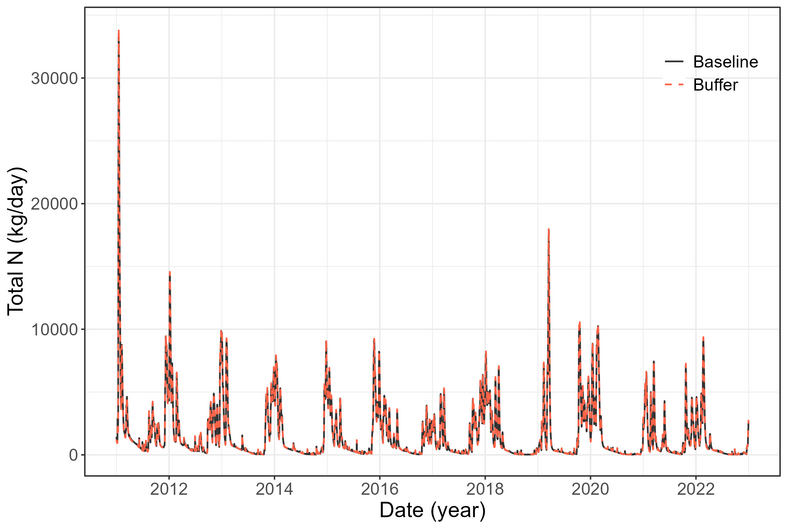
Scenario results
Buffer Strips

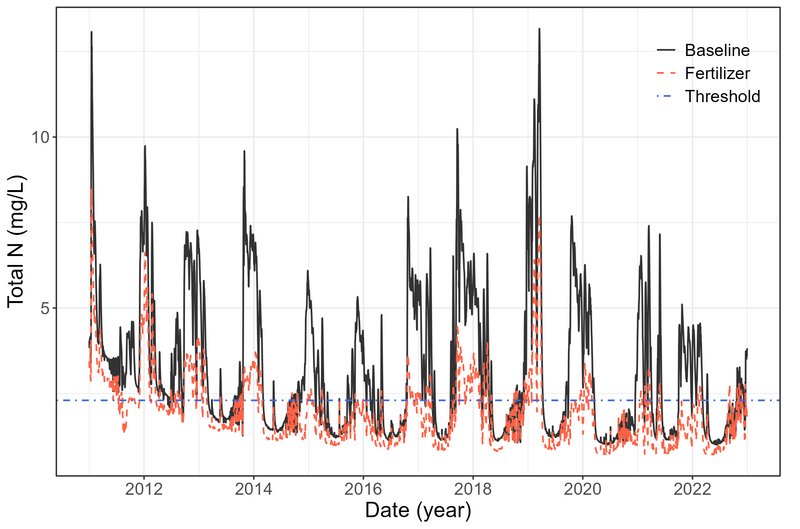
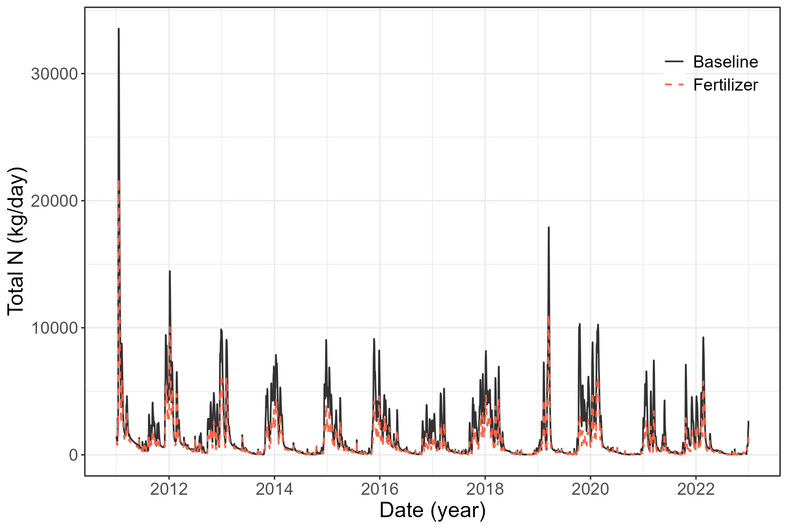
Fertilizer reduction
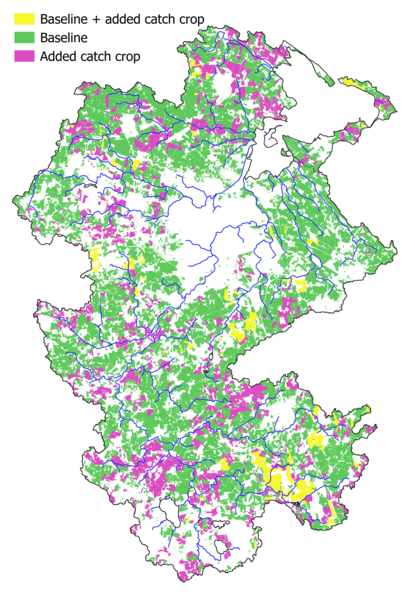
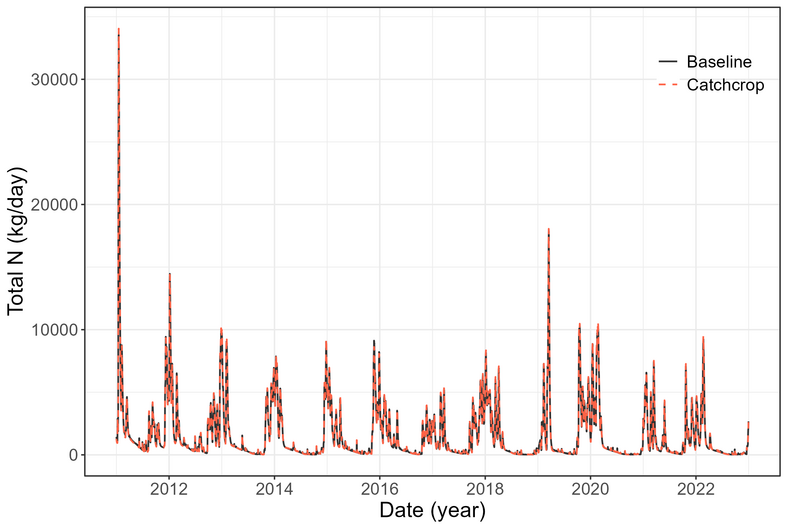
Catch crops

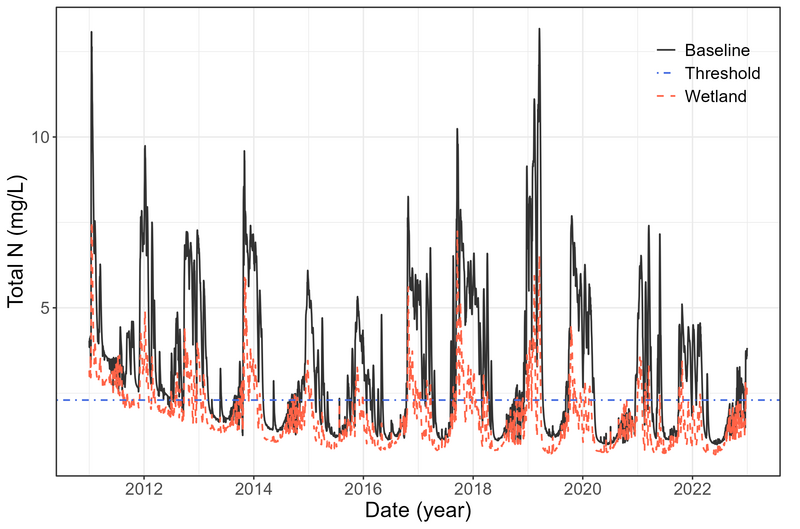
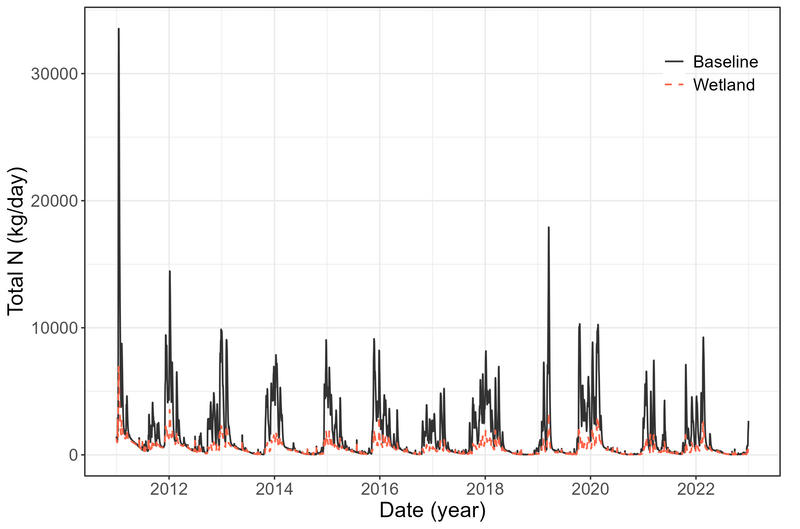
Wetland restoration