Fungicides

Current activities
Scientists from research institutions and industry in the fungicide subgroup - active in NORBARAG - collaborate on monitoring fungicide resistance in the Nordic Baltic region. At the yearly meetings we agree on how many samples should be collected in the coming season to map risk scenarios, where shifting of sensitivity to fungicide is taking place or expected to take place. The monitoring is carried out in collaboration with all partners in the region and the chemical industry. By the end of the testing, a common report is made collecting the available information. (Link).
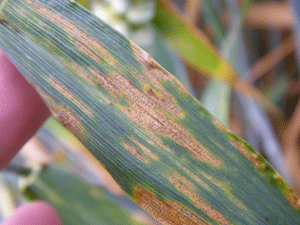
A major focus in recent years has been given to the shift in sensitivity to Zymoseptoria tritici. In both 2016 and 2017 a major reductionin field performances has been observed for azoles, which is caused by new mutations which led to reducedless sensitivity.
Objectives of the Fungicide Resistance subgroup
Create and update lists of known resistant diseases in the Nordic region
Harmonize and unify pesticide labeling in respect to resistance management for fungicides
Increase growers and advisors awareness of fungicide resistance and resistance management practices
Collaboration on fungicide resistance monitoring and screening
Finding funding for activities
Collaboration on screening for field performance of fungicides
Map with CYP51 mutation frequency in Europe
How to use the map?
The map shows the distribution of CYP51 mutation in Zymoseptoria tritici in different years. The pie charts represent the percentage of the respective point mutations by country – the red piece accounts for the percentage harbouring the mutations, the green piece shows how many per cent of the population still has not mutated. Use the radio buttons to select the specific year and point mutation.
Evolution of point mutations across years
How to use the Chart?
The chart shows the distribution of CYP51 mutation in Zymoseptoria tritici across years. The bars represent the percentage of the respective point mutations by country – the red piece accounts for the percentage harbouring the mutations, the green piece shows how many per cent of the population still has not mutated. Use the radio buttons to select a specific country and a point mutation to display.