Contact persons:

Link to the report: The HIRHAM Regional Climate Model, Version 5 (ß), Technical Report 06-17.

Read more about the HYCOM model: http://ocean.dmi.dk/models/hycom.uk.php
Marine ecosystem model validation at DMI
Marine ecosystem model validation at AU
The North Sea-Baltic Sea area is modelled by the dynamic coupled model system HBM-ERGOM. Hydrodynamics are simulated by the 3D ocean circulation Hiromb-BOOSE model (HBM). The model has a coarse grid of 6 nm horizontal resolution (50 vertical layers) and a finer grid of 1 nm resolution (52 vertical layers) two-way nested from the Kattegat to the Arkona Basin. The Ecological ReGional Ocean Model (ERGOM) was developed to the Baltic Sea and later adapted to the North Sea. ERGOM now contains 11 pelagic and 1 benthic state variables describing the nitrogen cycling through 3 groups of phytoplankton (diatoms, flagellates and cyanobacteria), microzooplankton (protozoans), mesozooplankton and organic N and changes in sea water concentrations of nutrients (NO3, NH4, PO4, SiO2), dissolved O2 and organic matter in the sediment. ERGOM is mass conserving for nitrogen, whereas the dynamics of PO4 and SiO2 are coupled to the N dynamics through a Redfield ratio (N:P = 16 and N:Si = 1.1) for the organic fractions. ERGOM considers the processes of nutrient uptake, biomass growth, grazing, mortality, pelagic- and benthic recycling, respiration, denitrification, nitrification, N2-fixation, and sedimentation.
References:
Maar, M., S.S. Markager, K.S. Madsen, J. Windolf, M.M. Lyngsgaard, H.E. Andersen, E.F. Møller. 2015. The importance of local versus external nutrient loads for Chl a and primary production in the Western Baltic Sea. Ecol Model. 320: 258-272.
Maar, M., J. Larsen, E.F. Møller, K.S. Madsen, Z. Wan, J. She, L. Jonasson, T. Neumann. 2011. Ecosystem modelling across a salinity gradient from the North Sea to the Baltic Sea. Ecol Model. 222: 1696-1711.
Wan, Z., J. She, M. Maar, L. Jonasson, J. Baasch-Larsen. 2012. Assessment of a physical-biogeochemical coupled model system for operational service in the Baltic Sea. Ocean Science 8: 683-701.
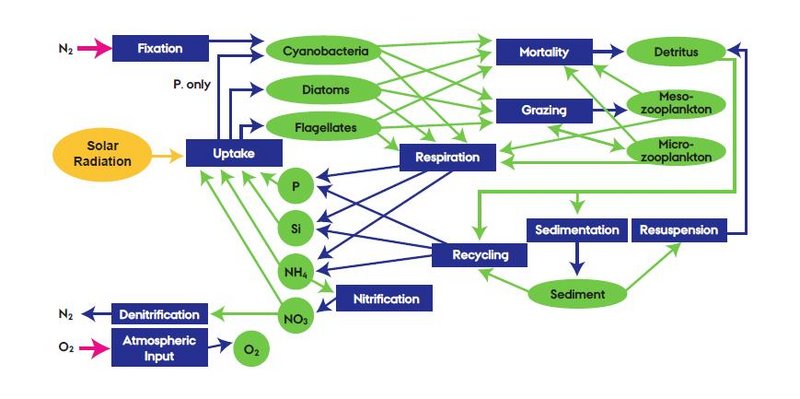

Fig. 1. Diagram of the stage-structured zooplankton model.
The structured model of zooplankton life-stages (Fig. 1) was based on a model developed by Fennel (2001) and has previously been applied for several copepod species (Neumann & Fennel 2006; Moll & Stegert 2007; Eisenhauer et al. 2009; Stegert et al. 2009). The model used in MEMC was parameterised for two of the dominant copepods in the North Sea, C. finmarchicus and C. helgolandicus.
The model considered five life-stages namely 1) eggs to nauplii I-II, 2) nauplii III-VI, 3) copepodites I-III, 4) copepodites IV-V and 5) adults (Fig. 1). The general scheme used two sets of equations, one to describe the flux of biomass through the group of stages, the other one to describe the flux of abundance of individuals. Development was described by the change in mean individual weight through gain (ingestion) and loss (egestion, respiration, excretion, mortality) of matter. Moulting to the next stage depended on a critical moulting weight and egg production depended on a critical female weight assuming that 50 % of the adult population was females.
The parameterisation of C. finmarchicus and C. helgolandicus models was based on literature values and new grazing experiments (Møller et al. 2012; Maar et al. 2013). Both species were found to have the same ingestion response (type III) to food concentrations whereas the dome-shaped response to temperatures differed between the two species. The ingestion rate of C. finmarchicus was found to be higher than for C. helgolandicus at temperatures below 15 °C whereas and vice versa at temperatures above 15 °C.
The stage-structured models were coupled to ERGOM through ingestion, egestion, respiration and mortality except for the first stage that was non-feeding (Fig. 1). Initial data (January) and monthly boundary data of abundances of Calanus spp. (CIV - CV and adults) were obtained from the Continuous Plankton Recorder (CPR) at 7 m depth (Johns 2009) and assumed to be homogenously distributed with depth.
References:
Eisenhauer et al. (2009) Zooplankton population model coupled to a biogeochemical model of the North Western Mediterranean Sea ecosystem. Ecol Model. 220:2865-2876.
Fennel (2001) Modeling of copepods with links to circulation models. J Plank Res 23:1217-1232.
Johns (2009) Monthly averaged data for zooplankton (48-63N, 10W-12E) 1946-2007 as recorded by the Continuous Plankton Recorder, Sir Alister Hardy Foundation for Ocean Science. Plymouth.
Maar, M., Møller E.F., Gürkan, Z., Jónasdóttir, S.H., Nielsen, T.G. (2013). Sensitivity of Calanus copepods to environmental changes in the North Sea using life-stage structured models. Prog Oceanogr. 111:24-37.
Moll and Stegert (2007) Modelling Pseudocalanus elongatus stage-structured population dynamics embedded in a water column ecosystem model for the northern North Sea. J Mar Syst 64:35-46.
Møller E.F., Maar, M., Jónasdóttir, S.H., Nielsen, T.G., Tönnesson, K. (2012). The effect of changes in temperature and food on the development of Calanus finmarchicus and Calanus helgolandicus populations. Limnol Oceanogr 57(1):211-220).
Neumann and Fennel (2006) A method to represent seasonal vertical migration of zooplankton in 3D-Eulerian models. Ocean Model 12:188-204.
Stegert et al. (2009) Validation of the 3D ECOHAM model in the German Bight for 2004 including population dynamics of Pseudocalanus elongatus. J Sea Res 62:1-15.
 model")
Dynamic Energy Budget (DEB) models describe the eco-physiological response of the organism to the surrounding environment. DEB models can be applied to all organisms, but we apply the model to blue mussels, which often are very dominant in the Danish coastal areas and estuaries. The model describes the food uptake, egestion, allocation of energy to growth, respiration and reproduction based on measurements of water temperature, salinity and food levels. The model can be combined with a population model describing recruitment and mortality caused by predation, starvation, hypoxia and fishing. The model is applied to i) estimate the growth of mussels in natural habitats, on wind farm foundations and in line-cultures, ii) investigate the ecological effects of mussels on environmental indicators, iii) investigate the use of mussel compensation cultures in removing nutrients through harvesting, and iv) estimate the bioaccumulation of harmful substances in mussels.
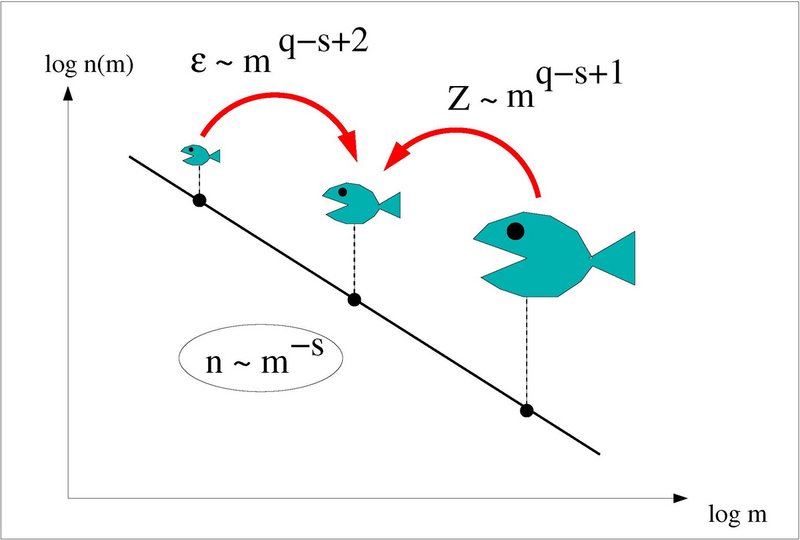
The description of top-down processes (mortality) on the zooplankton community is usually very simplified without taken the spatio-temporal variability of the predators and environmental factors into account. We tested the feasibility of imposing mesozooplankton mortality into a 3D model based on estimated consumption rates of the dominant planktivorous fish in the North Sea-Kattegat area (Maar et al. 2014). The spatial biomass distribution of Atlantic herring (Clupea harengus), horse mackerel (Trachurus trachurus), Atlantic mackerel (Scomber scombrus), sandeel (Ammodytidae) and European sprat (Sprattus sprattus) was derived from quarterly scientific trawl surveys and Danish commercial catches. Spatio-temporal indices of mortality were created based on the estimated biomasses and temperature-dependent ingestion rates from the literature. The fish larvae grazing pressure was obtained from a spatial, size-based larval community model. In this model, herring (45 %), fish larvae (35 %) and sandeel (16 %) were the most important fish predators on mesozooplankton, but these groups had different spatial and seasonal distributions. The applied fish consumption in the model changed the temporal and spatial patterns of mesozooplankton biomass, production and mortality in comparison with the reference scenario using a constant mortality of zooplankton biomass per day. This novel approach seems to provide more realistic mortality terms by integrating the variability in fish community consumption rates on lower trophic levels in the food web. This approach can be applied in areas with available data on fish stocks to improve management of marine resources.
Reference:
Maar, M., A. Rindorf, E. F. Møller, K. S. Madsen, A. Christensen and M. van Deurs. 2014. Zooplankton mortality in 3D ecosystem modelling considering variable spatial-temporal fish consumption in the North Sea. Prog Oceanogr. 124: 78-91.


The modelling framework Flexsem is a fast, flexible and very user-friendly tool specifically targeted towards scientific and management challenges of the complex biogeochemical processes in coastal and open ecosystems. Flexsem is a modular marine modelling framework, which contains both a simplified formulation of estuarine hydrodynamics and offline 3D hydrodynamics for open waters and descriptions of pelagic and benthic biogeochemical processes.
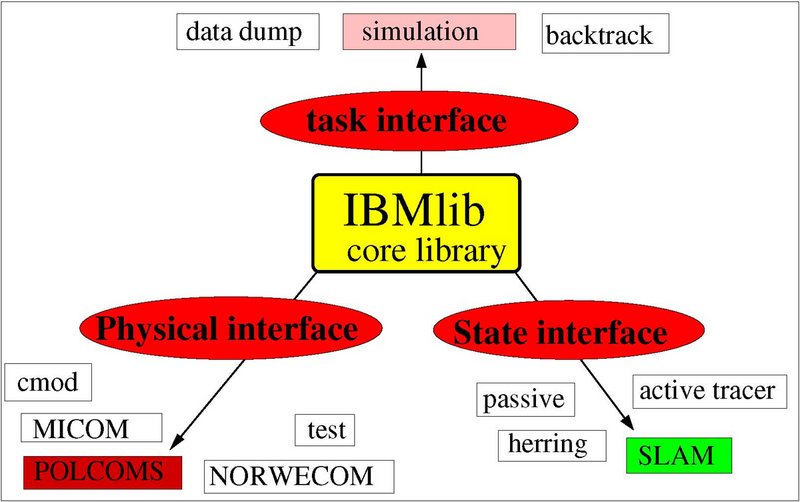
IBMlib - A generic Tool for individual-based modelling of aquatic organisms (manual dated 8 February 2016).