
The line in the sand: Establishing catchment areas for Roman Palmyra
By Research Assistant Joan Campmany Jiménez.
In December 2021, we explained the necessity to establish the area around Palmyra that its inhabitants could have farmed as a first step towards calculating its carrying capacity. We had developed a model where both topography and hydrography influenced the speed of travel from Palmyra. While the model already showed some trends, it was still very rough. For most of December, the Circular Economy and Urban Sustainability in Antiquity project team has been working on improving this basic model.
The first version of the model had two main problems. On the one hand, relief barely seemed to affect the speed and direction of travel at all, resulting in very unrealistic travel costs. On the other hand, hydrography influenced travel speed to an extreme and unrealistic degree.
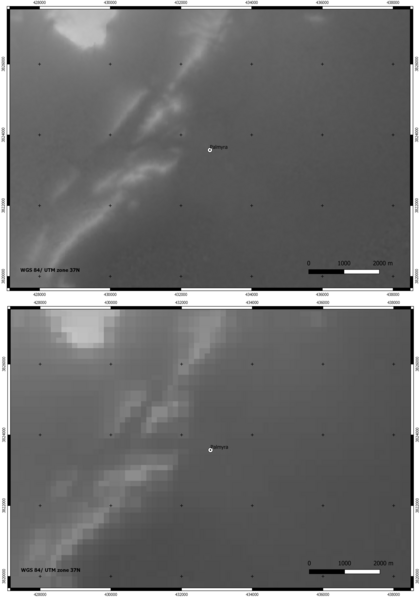
The first problem is not necessarily exclusive to our model. Indeed, GIS has been known to underestimate the importance of topography when calculating least-cost paths (Gietl et al. 2008). This means that, when confronted with the relatively low relief around Palmyra, most travel cost calculations will consider it irrelevant. We introduced three changes to solve this. First, we got a higher resolution elevation map. While for most large-scale purposes the GMTED2010 7.5 arc-second mean elevation dataset is more than enough, larger cells will inevitably result in a flatter map. Therefore, more resolution goes a long way towards highlighting the relief around the city. For this, we used the Shuttle Radar Topography Mission (SRTM) 1 Arc-Second Global elevation dataset, courtesy of the US Geological Survey, again reprojected in UTM projected coordinates and modified to have regularly sized cells (Figure 1). In this way, the cell size has been decreased from 150x150 m to 30x30 m.
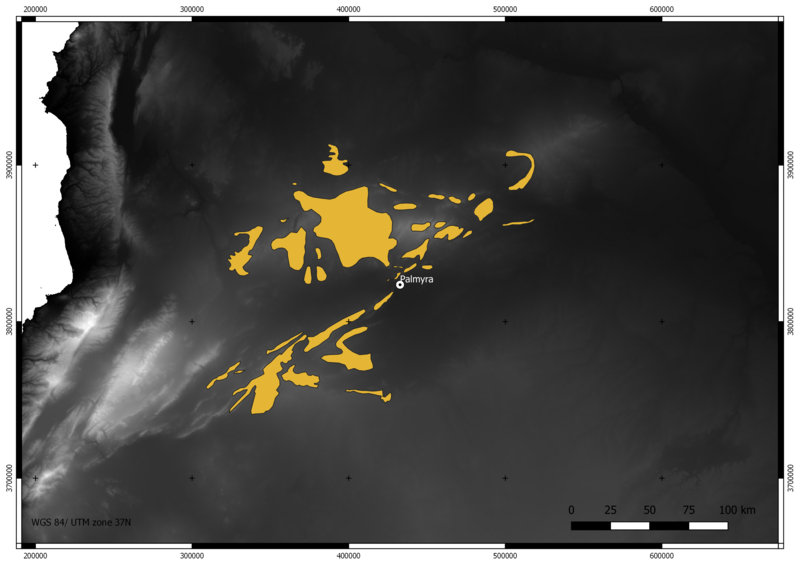
The second and third changes have been introduced in the “Slope” maps, a dataset generated from the elevation maps and used in the process of calculating travel cost areas. Increasing slope values results in higher travel costs. To begin with, we have established certain areas around Palmyra as difficult, but not impossible, to cross. These areas we have digitized from the 1/500000 provisional "Goings" map of Syria, produced in 1942 by the 19th Field Survey Company of the Royal Engineers. This map colors areas depending on their accessibility for a 40s British Army truck (Figure 2). Since areas impassable to trucks are passable to camels, we have not made these areas impassable, but significantly harder to cross, by adding a flat amount to the slope there. After that, we have also squared all slope values. This will increase all travel cost values in the final map, but it will increase higher values a lot more.
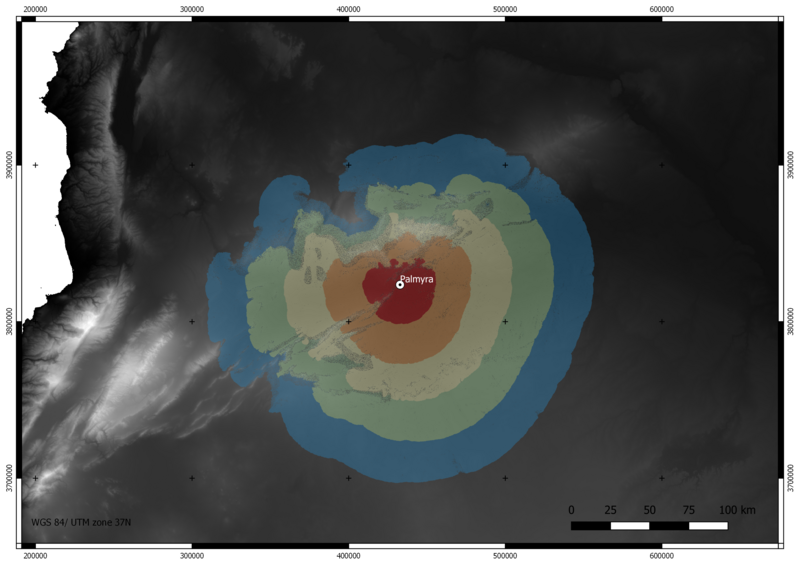
Once again, we have used Tobler’s Hiking Function (Tobler 1993) as adapted by White (White 2015). The result is a much more nuanced travel cost map (Figure 3). The problem of these methods is that by increasing the value of slopes in the input, the output values will no longer be hours per cell, as expected of Tobler’s Hiking Function. Instead, all travel cost values will be at least slightly higher. If we use higher friction values, each cell of the map is costlier to traverse, meaning that when calculating the cost of travel from Palmyra, cost isohyets and the areas contained within them will inevitably be smaller. However, it is probably better to slightly underestimate than slightly overestimate the catchment areas.
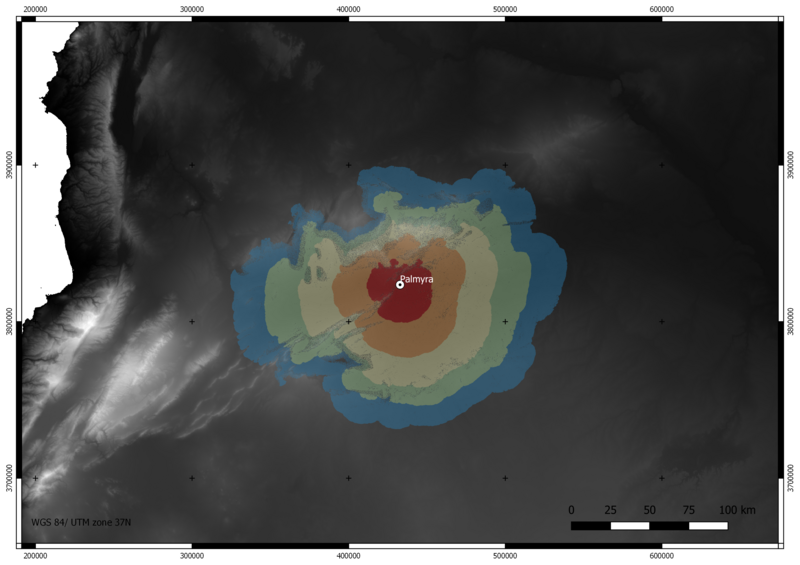
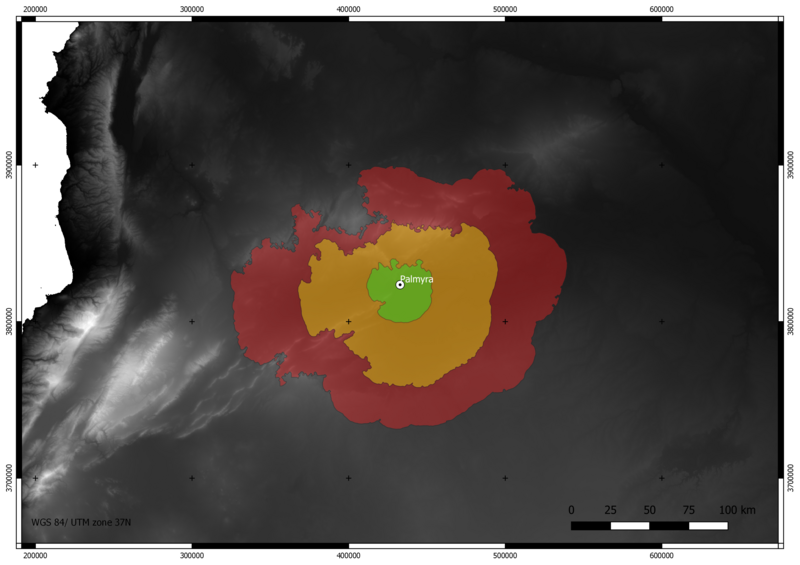
The second big problem our model had was the extreme degree to which hydrography distorted travel cost. Previously, areas far from water sources were twenty times harder to cross, which was too much. We have made these areas only twice as hard to cross now, and we have revised how each kind of water source distorts the cost around them. This was made possible thanks to the feedback kindly provided by Professor Dr. Eivind Seland (Bergen University, Norway). The result (Figure 4) is a more useful and realistic map, which will be used as a basis to calculate the carrying capacity of the area surrounding Palmyra.
The first accumulated cost map we made used 6 hour intervals, representing one day of travel, based on the fact that camels could likely cover 30 km in a day easily (Meyer & Seland 2016, p. 507) and that it seemed unreasonable to move more than 5 km/hour at any time. We have retained these intervals, even if they do not correspond exactly to 6 hours but slightly less. Once again, it is better to slightly underestimate than overestimate the catchment areas. With that done, we have selected the first, third, and fifth intervals as the areas close, accessible, and far from Palmyra (Figure 5). In this way, we will be able to test the carrying capacity of each, and therefore estimate how far from Palmyra its inhabitants would have had to go to get the resources necessary to sustain themselves.
More about this project is available at https://projects.au.dk/circulareconomy/
Augustinus Foundation: https://augustinusfonden.dk/
Carlsberg Foundation: https://www.carlsbergfondet.dk/en
References
- Gietl, R., Doneus, M., & Fera, M. (2008). Cost Distance Analysis in an Alpine Environment: Comparison of Different Cost Surface Modules. In A. Posluschny, K. Lambers & I. Herzog (Eds.), Layers of Perception. Proceedings of the 35th International Conference on Computer Applications and Quantitative Methods in Archaeology (CAA), Berlin, Germany, April 2–6, 2007, Kolloquien zur Vor- und Frühgeschichte 10, Bonn, 336–341.
- Hanson, J. W. (2016). An Urban Geography of the Roman World, 100 BC to AD 300 (Vol. 18). Archaeopress Oxford.
- Meyer, J. C., & Seland, E. H. (2016). Palmyra and the Trade Route to the Euphrates. Hatra, Palmyra and Edessa. Cultural Exchanges between Cities in the Fertile Crescent before Islam, 28, 1–2, 497–523.
- Tobler, W. (1993). Three Presentations on Geographical Analysis and Modeling (Technical Report No. 93–1). National Center for Geographic Information and Analysis.
- White, D. A. (2015). The Basics of Least Cost Analysis for Archaeological Applications. Advances in Archaeological Practice, 3(4), 407–414. Cambridge Core. https://doi.org/10.7183/2326-3768.3.4.407
Data Sources
- Hanson, J. W. (2016). Cities Database (OXREP databases) Version 1.0. Accessed 6 November 2020. oxrep.classics.ox.ac.uk/databases/cities/; DOI: https://doi.org/10.5287/bodleian:eqapevAn8
- Seland, E. H. (2019). Water sources in the Syrian Desert. Accessed 6 November 2020. DataverseNO. https://doi.org/10.18710/CEY9QR
- US Geographic Survey. (2018). USGS EROS Archive—Digital Elevation—Shuttle Radar Topography Mission (SRTM) 1 Arc-Second Global. Accessed 6 December 2020. USGS. https://doi.org/10.5066/F7PR7TFT
- US Geographic Survey. (2011). USGS EROS Archive—Digital Elevation—Global Multi-resolution Terrain Elevation Data 2010 (GMTED2010). Accessed 5th November 2020. USGS. https://doi.org/10.5066/F7J38R2N
- 19th Field Survey Company of the Royal Engineers. (1942). Levant 1 / 500 000 Sheets 2-3, 5-6, provisional "Goings" overprint dated March 1942. Accessed 14th December 2020. https://nla.gov.au/nla.obj-2237683394/view.