Sensor monitoring
What are sensors?
What are sensors?
Monitoring is an important part of any study of eutrophication, and in NORDBALT ECOSAFE we are exploring the use of the relatively novel method of monitoring by sensors. A water quality monitoring sensor is a device that can monitor a set of parameters frequently and in real-time. The sensors can be placed in streams, lakes, groundwater wells, or coastal waters. In our policy brief we list advantages and challenges with sensor monitoring and give examples of sensor use. Note that the brief is produced in several languages.
Real-time data from our interactive map
Real-time data from our interactive map
One of our aims is to enhance the citizen awareness on water quality matters by offering real-time access to a set of sensor data in stream monitoring stations. Check out our interactive map: Where you find a yellow star, you may click on that star, and you will be taken to a site showing real-time data from that stream. You can also access the data from links in our fact sheets, found below.
Watch up: Our real-time data are not yet quality controlled
Watch up: Our real-time data are not yet quality controlled
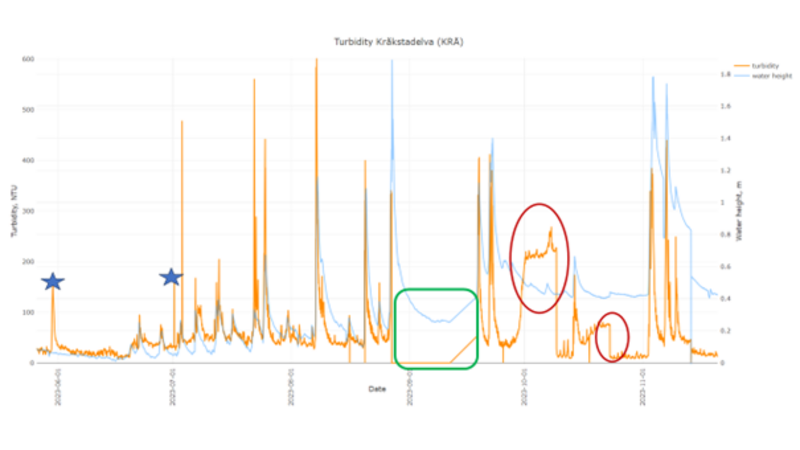
It is very important to understand that on-line data have not yet been quality controlled. This means, that before we use the data for research or management purposes, we have to go through them and ‘clean up’ any incorrect or suspicious data. Such errors can occur for many reasons, some of these are listed below:
- Power outage or other problems with the equipment.
- Leaves or other organic debris may temporarily clog the lens, giving short-term artificially high levels.
- Biofilm or sediments on the lens may give longer periods of too high recordings. (this is often detected when the sensors are cleaned manually).
- Some sensors can only be operated in the time of year without ice and snow.
The figure below shows some examples of such typical errors. Commonly, we keep the original data series, but replace it with one where the suspicious data have been removed, unless we can find an explanation of these data. Despite of such potential errors in the sensor dataseries, we believe that displaying real-time data to citizens will be of value, also because the local inhabitants may have other explanations to some of these anomalies.
NORDBALT ECOSAFE is working towards common procedures for quality assuring sensor data, and a PhD student at AU is presently writing a paper on an automated quality control tool. The tool is expected to be available on-line, in open access, later this year. The developments will be posted at this web site.
Link to sensor stations in Denmark
- Horndrup Bæk, Denmark: https://vap.au.dk/sortholmvej/index.html
- Vejle Å, Haraldskær, Denmark: https://vap.au.dk/haraldskaer/index.html
Link to sensor stations in Norway
Skuterudbekken
- Station name: Skuterud
- Link to on-line turbidity (FNU) (30 days) https://kart8.nibio.no/nordbalt_ecosafe/sku.html
- Coordinates: 59°41′6″ N 10°49′52″E
- Catchment area: 4.5 km2
- Land use: agricultural land 61%, forest 29%, urban areas 8%, wetland 2%
- Dominant soil type: silty clay 76%, silty sand 15%, sandy clay 7%
- SEBA sensor
- Please note: Sensor data are updated each day at 9:00.
- Station name: Kråkstadelva
- Link to on-line turbidity (FNU) (30 days) https://kart8.nibio.no/nordbalt_ecosafe/kra.html
- Coordinates: 59°36′38″N 10°53′19″E
- Catchment area: 47 km2
- Land use: agricultural land 44%, forest 45%, urban areas 7.3%, bare land 2.5%, pastures 0.5%, wetland 0.4%, water 0.4%
- Dominant soil type: silty clay 83%, sandy clay 8%, silty sand 5%
- Please note: No winter operation. A link to data from 2023 is therefore provided here.
Link to sensor stations in Sweden
Station name: Hågaån
- Link to online turbidity (NTU), depth, conductivity and water temperature (30 days)
- https://ghapps.slu.se/plotapp/
- Coordinates: 59.806178, 17.604204
- Catchment area: 122 km2
- Land use: forest 41 %, agricultural land 25%, urban areas 18%, open land 12%, wetland and lakes 4%
- Soil type: clay 28 %, moraine 19%, rock and thin soils 19%, silty clay 15 %, hard surfaces 6%, peat 5%, 8 % other
- Type of sensor: InSitu Aquatroll 3000
- Deployed since 2018, all year deployment
- Please note: Sensor data is updated every day at 06.00
Link to sensor stations in Finland
Station name: Lepsämänjoki
- Link to sensor data: https://www.luodedata.fi/riverlepsamanjoki
- Coordinate: 60°26'15.527"N 24°37'54.718"E
- https://maps.app.goo.gl/6tKHgqYszVqR1ucS8
- Catchment area: 23 km²
- Dominant soil type: clay 46 %, open rock exposures 14 %, sand 11, sandy till 9 %
- Land use: forest 51 %, agricultural land 36 %, urban 8 %
- Sensors: EXO, Trios
Station name: Leppioja
- Link to sensor data: https://www.luodedata.fi/riverleppioja
- Coordinates: 64°47'55.963"N 25°34'26.689"E
- https://maps.app.goo.gl/kjbdMKEWfTKxidUQ8
- Catchment area: 29 km²
- Dominant soil type: fine sand 55 %, peat 17 %, coarse sand 7 %, till 7 %
- Land use: forest 51 %, agricultural land 46 %, urban 2 %
- Sensor: EXO
Different sensor data
