
Soil sampling – when size matters!
Include soil geochemistry when excavating. This can help detangle details that might be invisible on site and hidden in the excavated soils. In this study, PhD Student Pernille L. K. Trant demonstrates why the chosen sampling grid size actually does matter for the result and the archaeological interpretations.
By PhD Student Pernille L. K. Trant
Archaeological studies are increasingly incorporating methods from the natural sciences. Many of these can help interprete what is invisible to the naked eye. Among the more popular methods are micromorphology and soil geochemistry for mapping e.g. spatial patterns and recognition of activity areas within houses. Soil geochemistry has been used in archaeology through the last decades, and with increasing success and possibilities. However, no standard sampling protocol has been established, and different approaches to sampling strategies have been applied. To obtain reliable, surface-covering geochemical results, one needs to ask the question: How does the sampling strategy affect the result and the final interpretation?
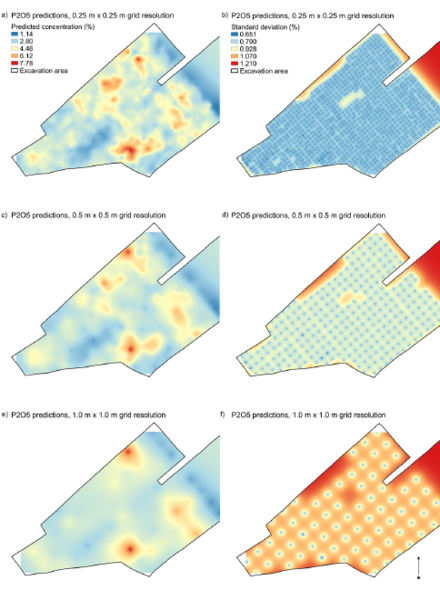
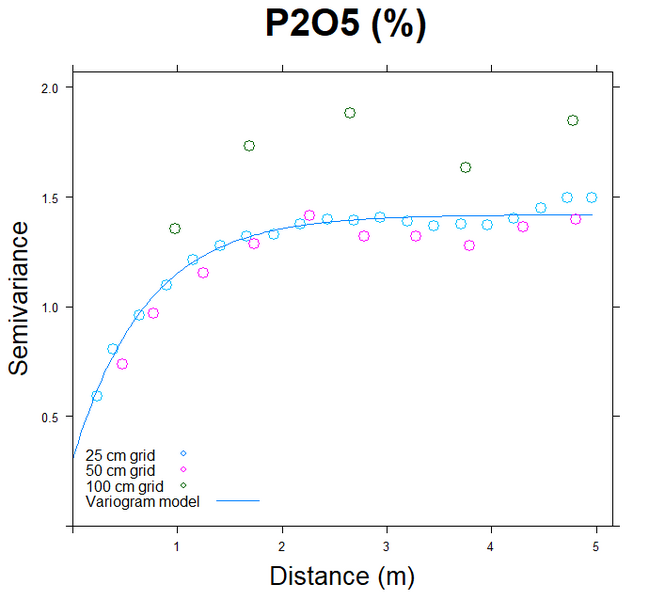
This question forms the basis of our newest study based on samples from the Northern Emporium excavation at Ribe. We have studied 1059 bulk soil samples taken across one house floor, creating a very high-resolution sampling grid of 0.25 m x 0.25 m covering the entire house. Based on the unprecedented number of samples, we can for the first time in archaeology compare how different sampling grid resolutions affect the spatial patterns arising from anthropogenic elemental markers such as calcium, phosphorous and strontium. Our results clearly demonstrate that producing maps based on high-resolution sampling (0.25 m grid) display a high degree of detail in the variation of elements and activity areas across the house floor with a low standard deviation. As a result, the exact locations and spread of bounded concentration zones are easily recognized in the graphical representation (Fig. 1a–b). Elemental maps based on a lower resolution (1 m grid), on the other hand, shows more blurred borders between high and low concentrations, and the indications of smaller activity areas are completely lost (Fig. 1e). Our results also show that samples located more than approximately 0.75 m from one another does not share any correlation, and hence, it is in this case not possible to produce statistically reliable maps when interpolating between samples at distances > 0.75 m (Fig. 2). Correlation between samples is a necessity, since one can only make meaningful interpolations of samples that are holding some degree of information about each other. Based on these results, we recommend to sample indoor areas in a grid with a maximum of 0.75 m between samples.
Together with Søren M. Kristiansen (UrbNet and Department of Geoscience, Aarhus University), Anders V. Christiansen (Department of Geoscience, Aarhus University), Barbora Wouters (UrbNet, Aarhus University and Research Foundation Flanders – FWO) and Søren M. Sindbæk (UrbNet, Aarhus University), Pernille L. K. Trant will soon be publishing these results.