The HISTFUNC project relies on extensive geospatial data available on ecosystem functioning, species distributions, and functional traits as well as on paleodistributions, phylogenies, paleoclimate, current environment, and human impacts, notably:
- Ecosystem functioning: Remote-sensing-based global and subglobal datasets on vegetation-related measures of ecosystem functioning including vegetation-type and growth-form cover, vegetation structure, vegetation productivity, chlorophyll content, biomass, and leaf/wood density. Supplementary ground-based measures will also be used (e.g., net primary productivity (e.g., http://daac.ornl.gov/ISLSCP_II/guides/gppdi_npp_point.html) and eddyflux data (e.g., http://www.fluxdata.org).
- Plant functional diversity: We have access to unprecedented amounts of species geographic and trait data for vascular plants. Europe: atlas-data (www.luomus.fi/english/botany/afe/), vegetation-plot data (59000 plots; likely >130000 plots during 2012, assembled by Jens Christian Svenning), and large amounts of functional traits available via trait databases such as TRY, try-db.org). New World: As a member of BIEN (Botanical Information and Ecology Network) Svenning has access to unprecedented amounts of spatial and trait data for New World vascular plants (5,916,095 occurrences, 96,897 spp.). Global: complete geographical and large amounts of trait data available for palms (2600 species). Functional diversity will be quantified using measures such as trait frequency distribution moments and functional diversity measures.
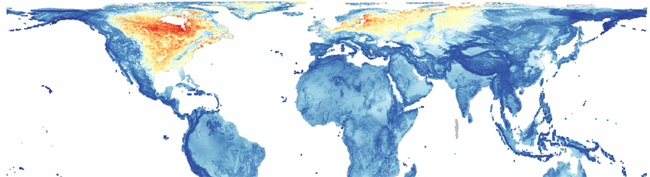
- Mammal functional diversity: For mammals, we have access to distribution data on all extant species for the whole Earth (www.iucnredlist.org/technical-documents/spatial-data) and for Europe (Atlas of European Mammals) as well as – via a ongoing project that Jens Christian has lead – on Late Quaternary extinct species, a large database that covers traits of extant as well as extinct species, including body mass, diet, habitat layer, activity cycle, migratory behavior, and population density (>5200 spp., mainly based on). We will again explore a variety of measures of functional diversity, now also measures that represent vertical (cross trophic) diversity.
- Species diversity: Plant and mammal species richness will be estimated using the geographic species and plot data used for computing functional diversity.
- Phylogenetic diversity: Estimated using geographic species data and phylogenetic data. Phylogenetic data (with a strongly supported overall phylogeny) is readily available for vascular plants. For palms, we have a dated, complete genus-level phylogeny available as well as much additional resolution within many genera. For mammals, we have available a complete, dated phylogeny for all extant species. We will explore a variety of measures of phylogenetic diversity.
- Long-term historical drivers: The project has access to paleoclimatic simulations for the Oligocene–Pliocene, Late Quaternary (Last Interglacial, Last Glacial Maximum, mid-Holocene), and last 100-200 years. Lineage biogeographic history will be represented by the presence and diversity of specific clades. Megafaunal extinction effects will be represented using data on distributions of Late Quaternary extinct mammals.
- Environmental drivers: Contemporary climate (e.g., www.climond.org/), soil (www.iiasa.ac.at/Research/LUC/External-World-soil-database/HTML/), topography (e.g., www2.jpl.nasa.gov/srtm/), etc.
- Simulation data: Potential future environmental changes, notably in climate (e.g., www.climond.org/). Data for parameterizing dispersal simulations (notably trait data for estimating dispersal distances and reproductive potential, from TRY) and for representing physiological effects (notably changing CO2 levels), estimated from DGVMs. Data for reparameterising DGVMs: Key components such as estimating regional species pools, associated traits differences, and developing regional calibration of vegetation-climate relationships in DGVMs require diversity and functional trait data as used under objectives 1-5.
- Data processing: Response and predictor variables will often be computed by sophisticated geospatial processing and modeling using Geographic Information System software. ENVI will be used to handle remote sensing data. Functional and phylogenetic diversity will be computed using R.
- Kissling et al. 2014
Data from: Establishing macroecological trait datasets: digitalization, extrapolation, and validation of diet preferences in terrestrial mammals worldwide.
Dryad Digital Repository.doi:10.5061/dryad.6cd0v