DisclaimerAlthough every effort has been made to ensure the accuracy of the material available as download on this website, complete accuracy cannot be guaranteed. Neither the Environmental Protection Agency nor the project team accept any responsibility whatsoever for loss or damage occasioned, or claimed to have been occasioned, in part or in full, as a consequence of any person acting, or refraining from acting, as a result of a matter contained on this website. The data provided on this webpage may be used without further permission, provided the source is explicitly acknowledged. |
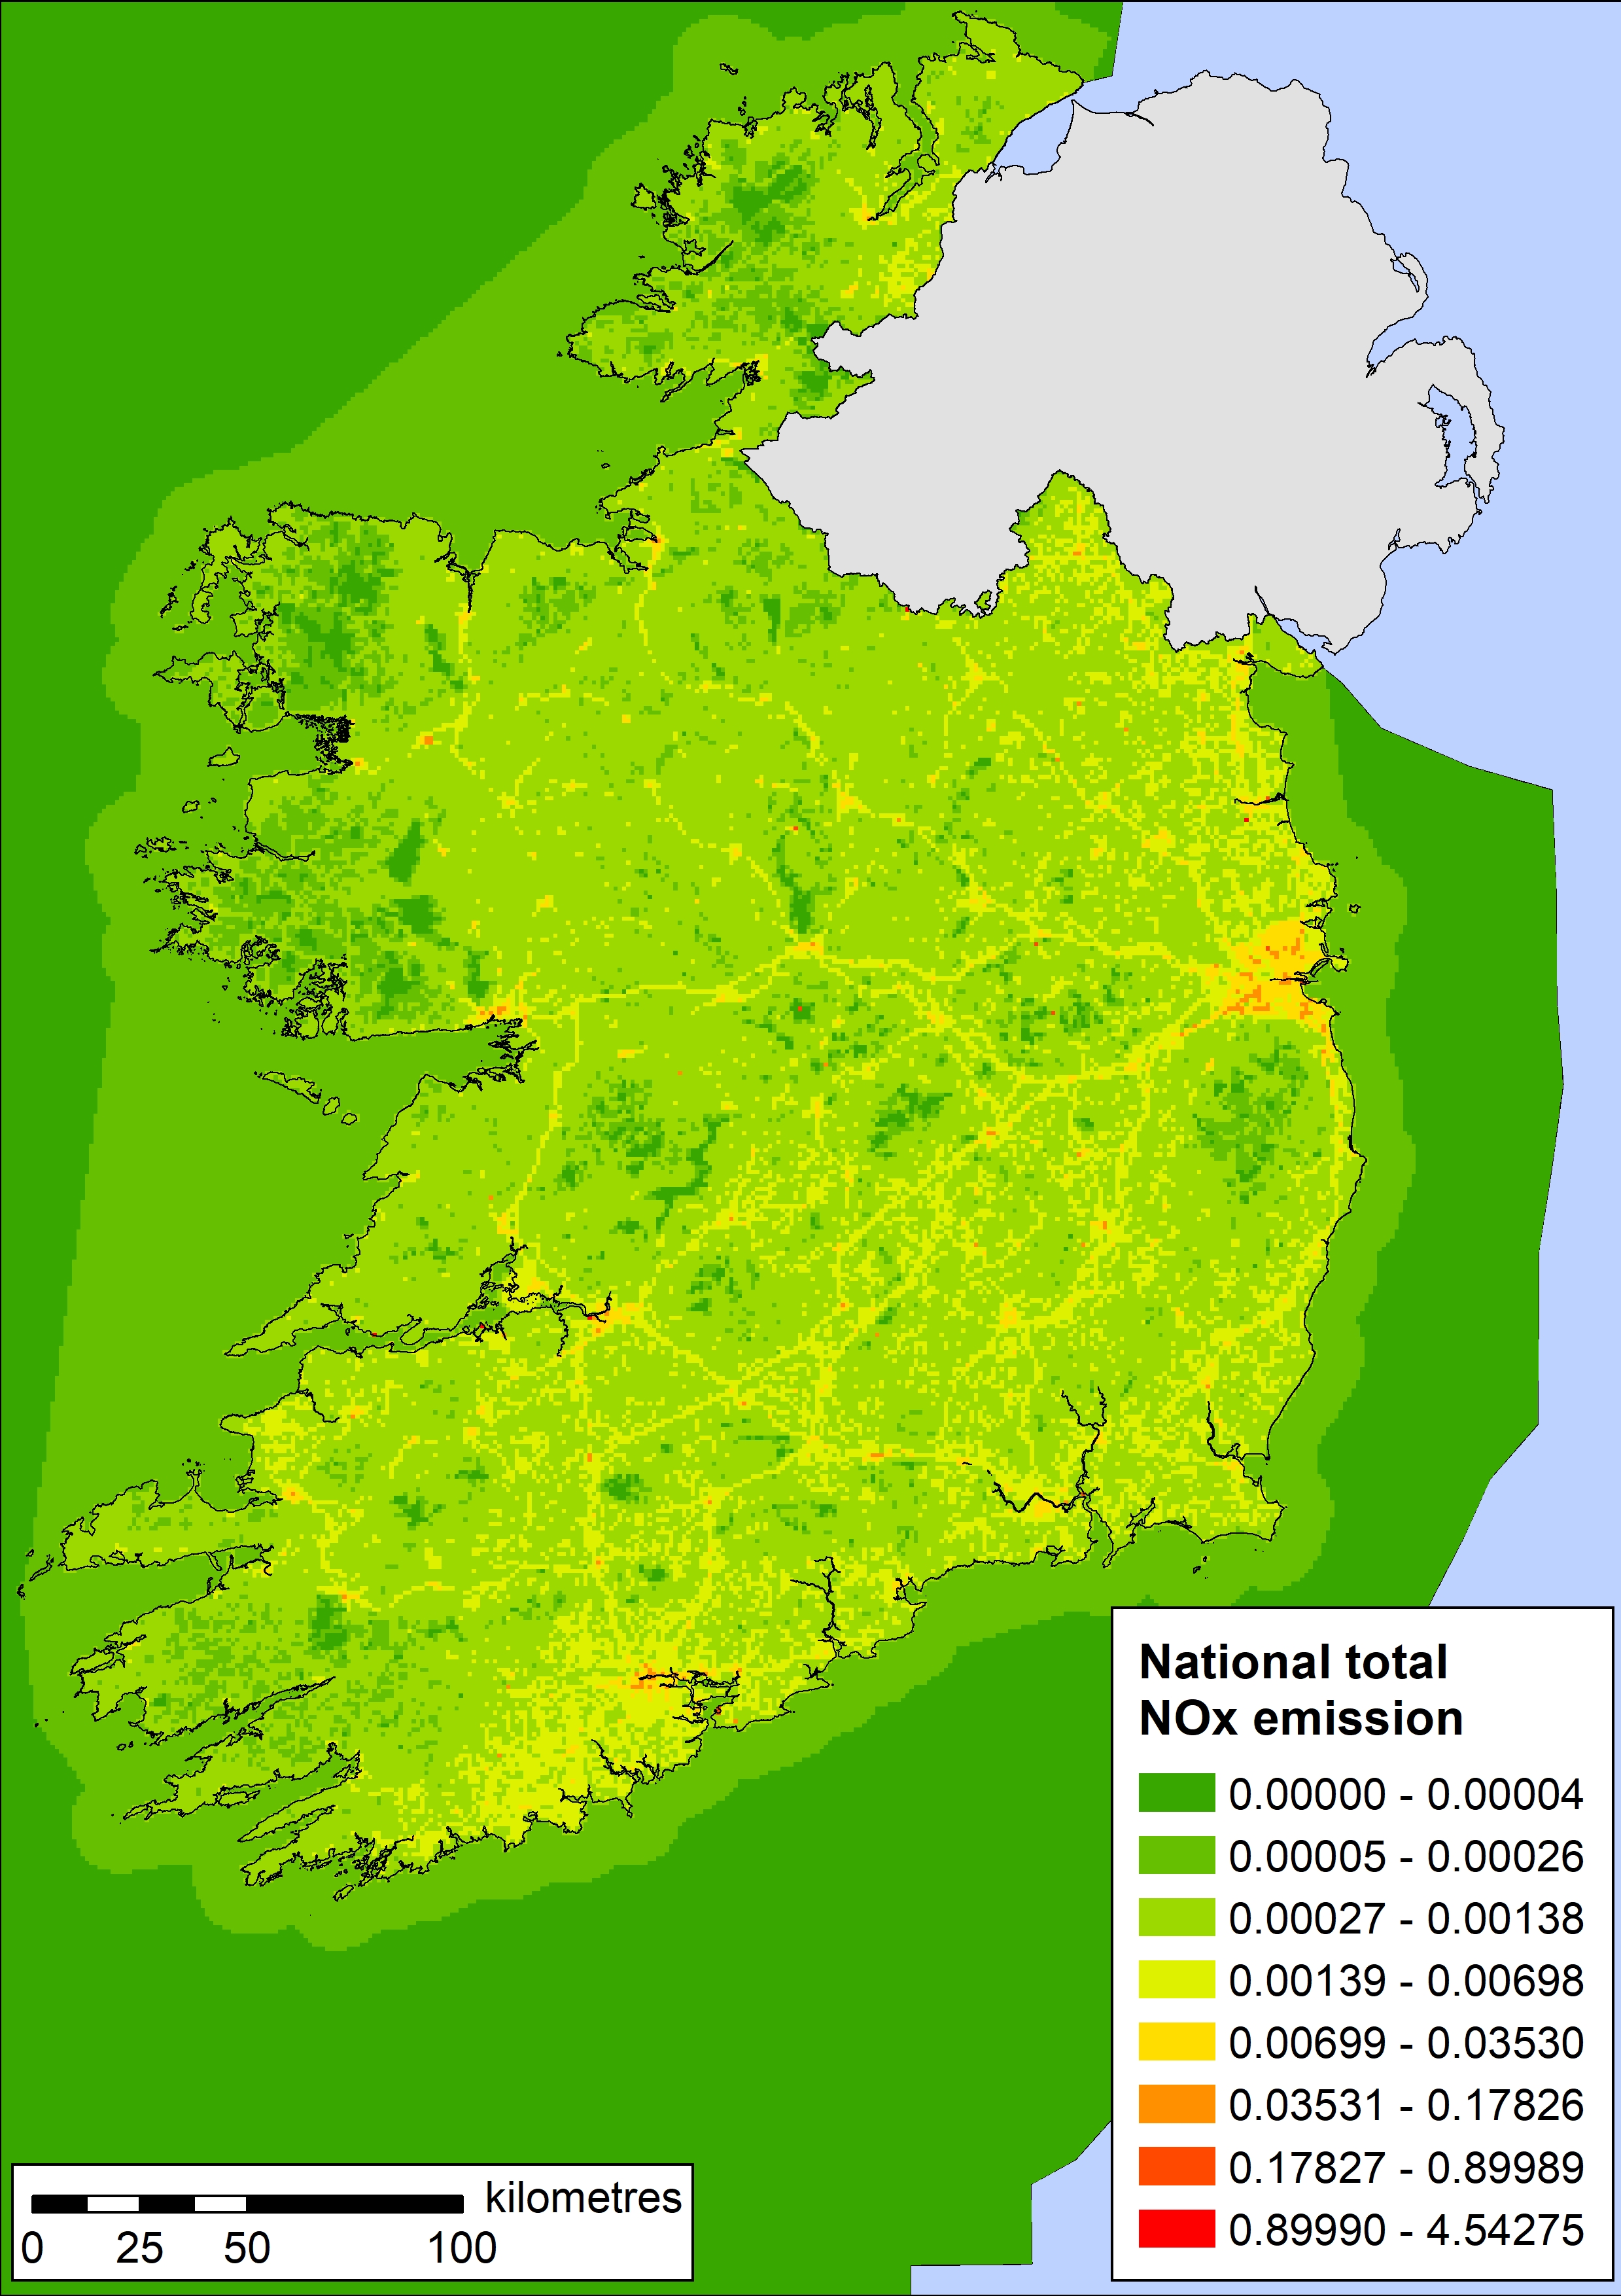
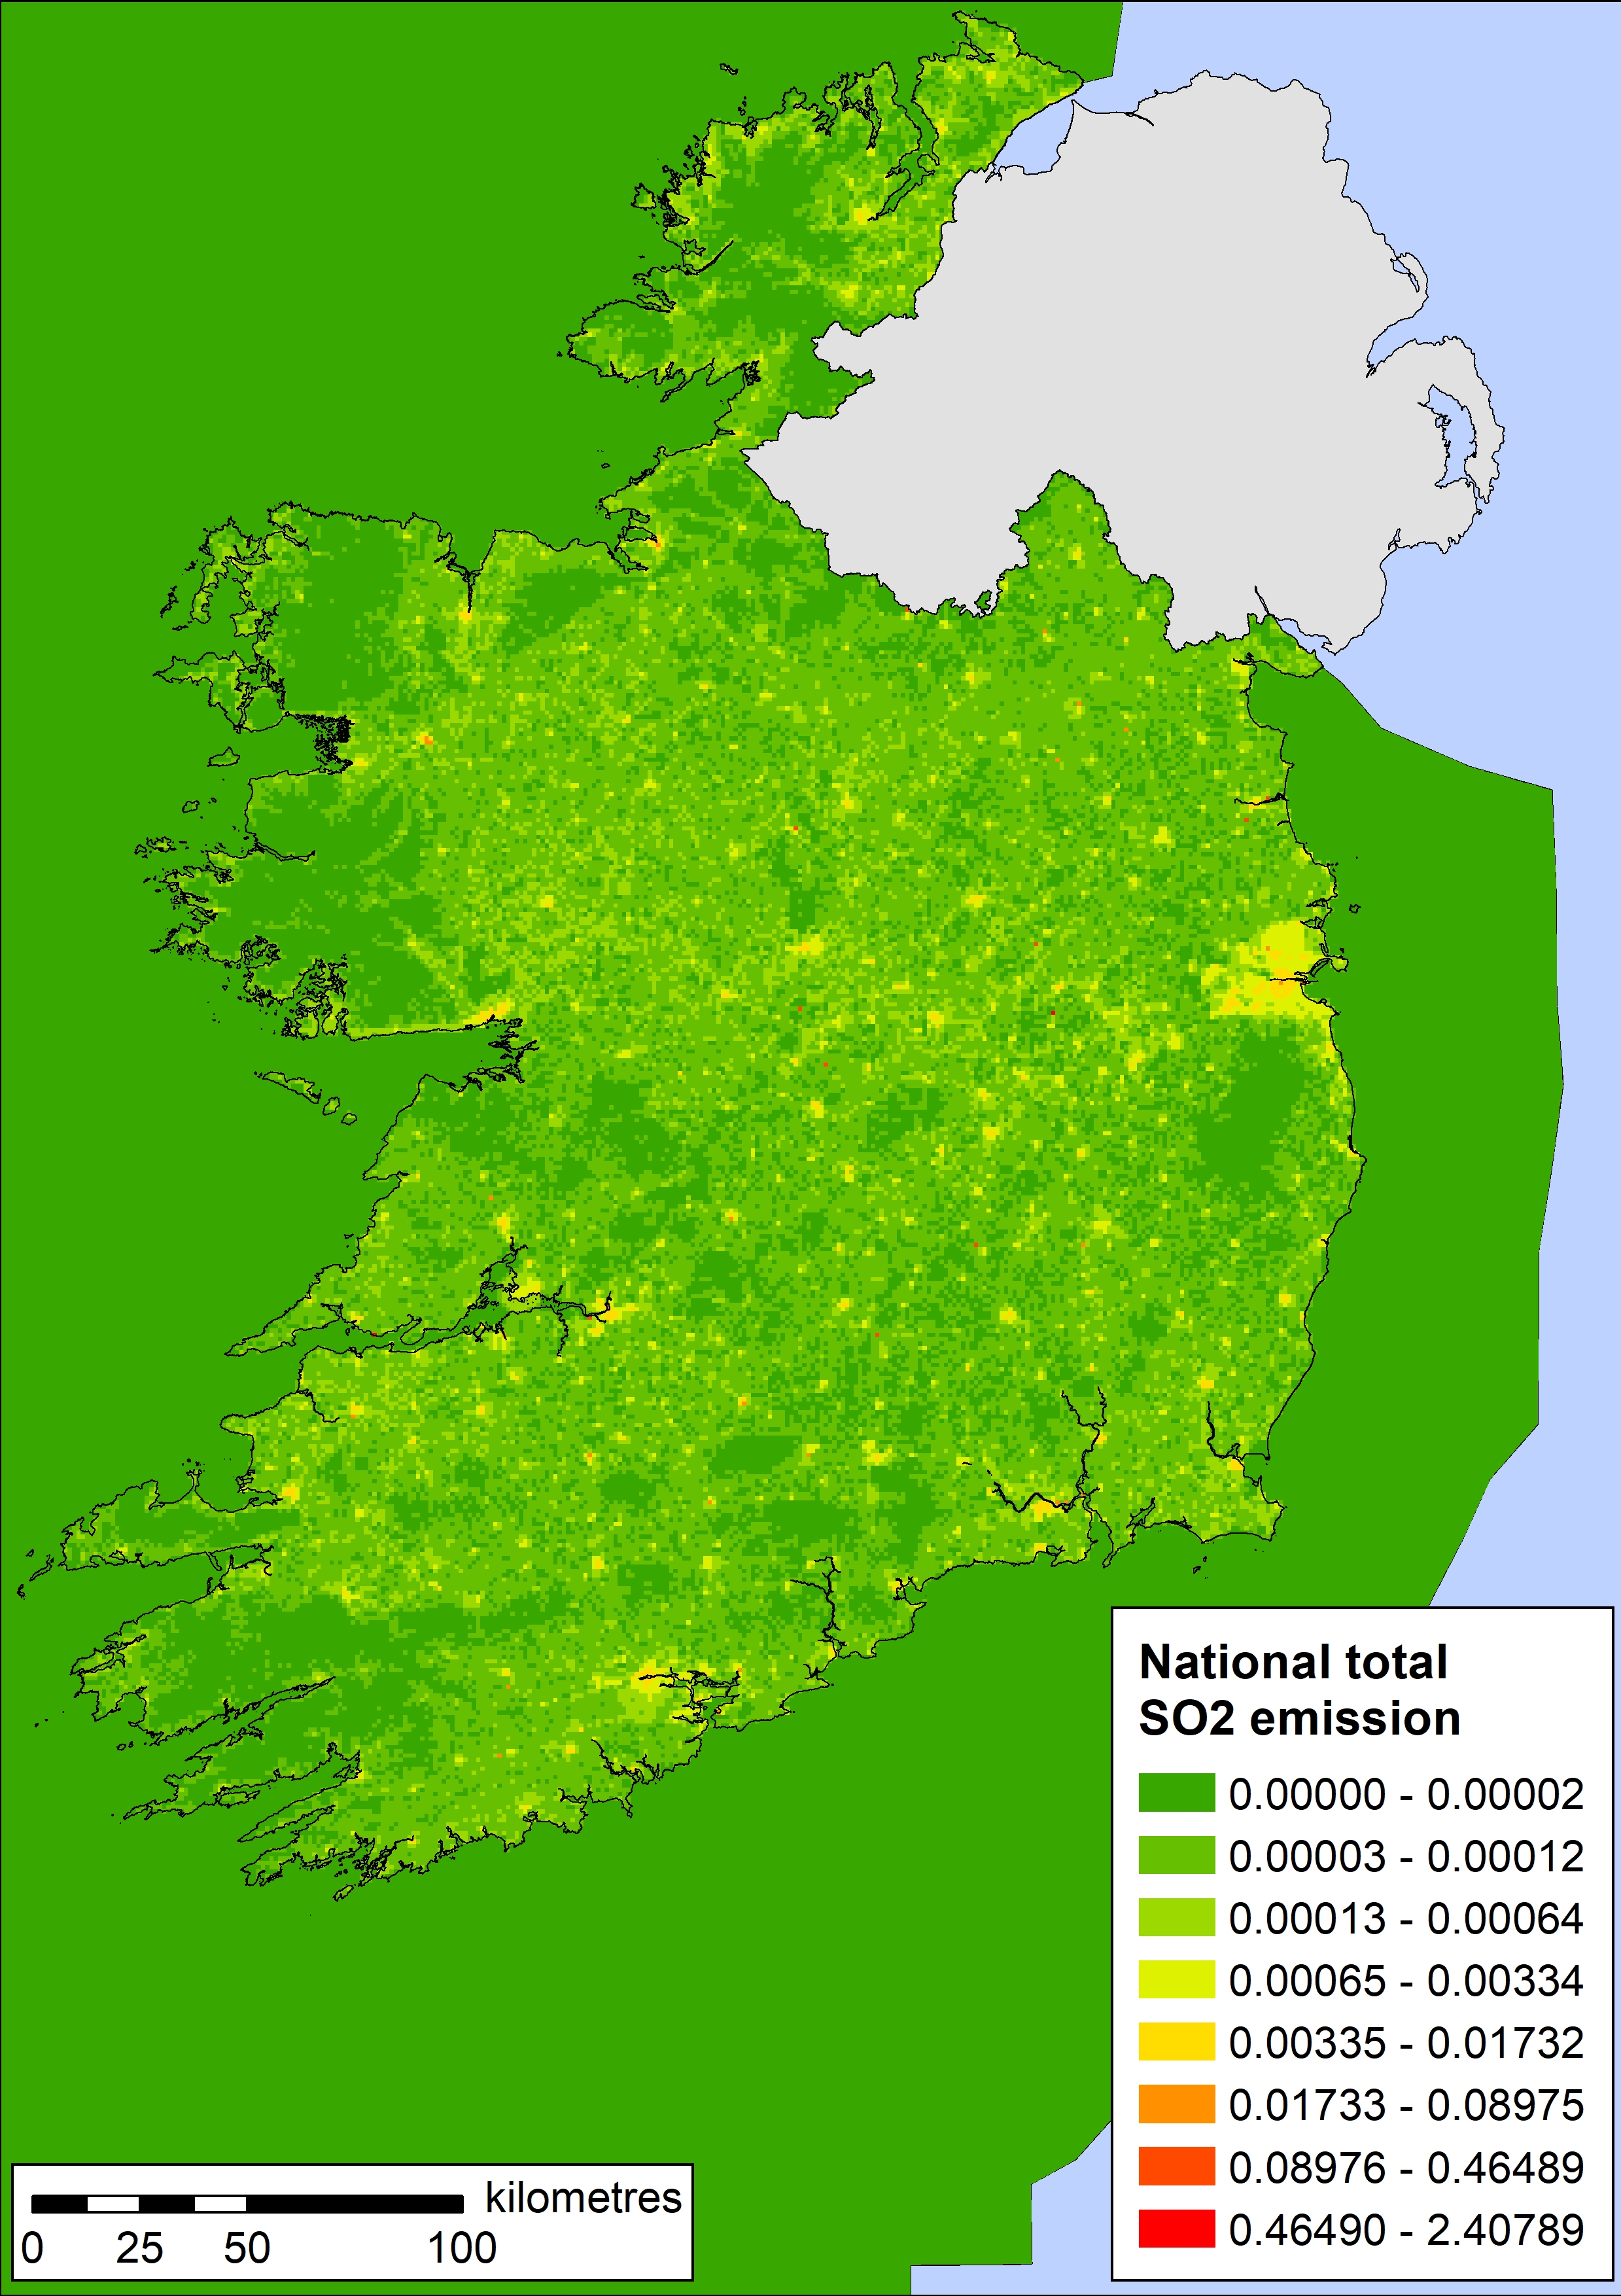
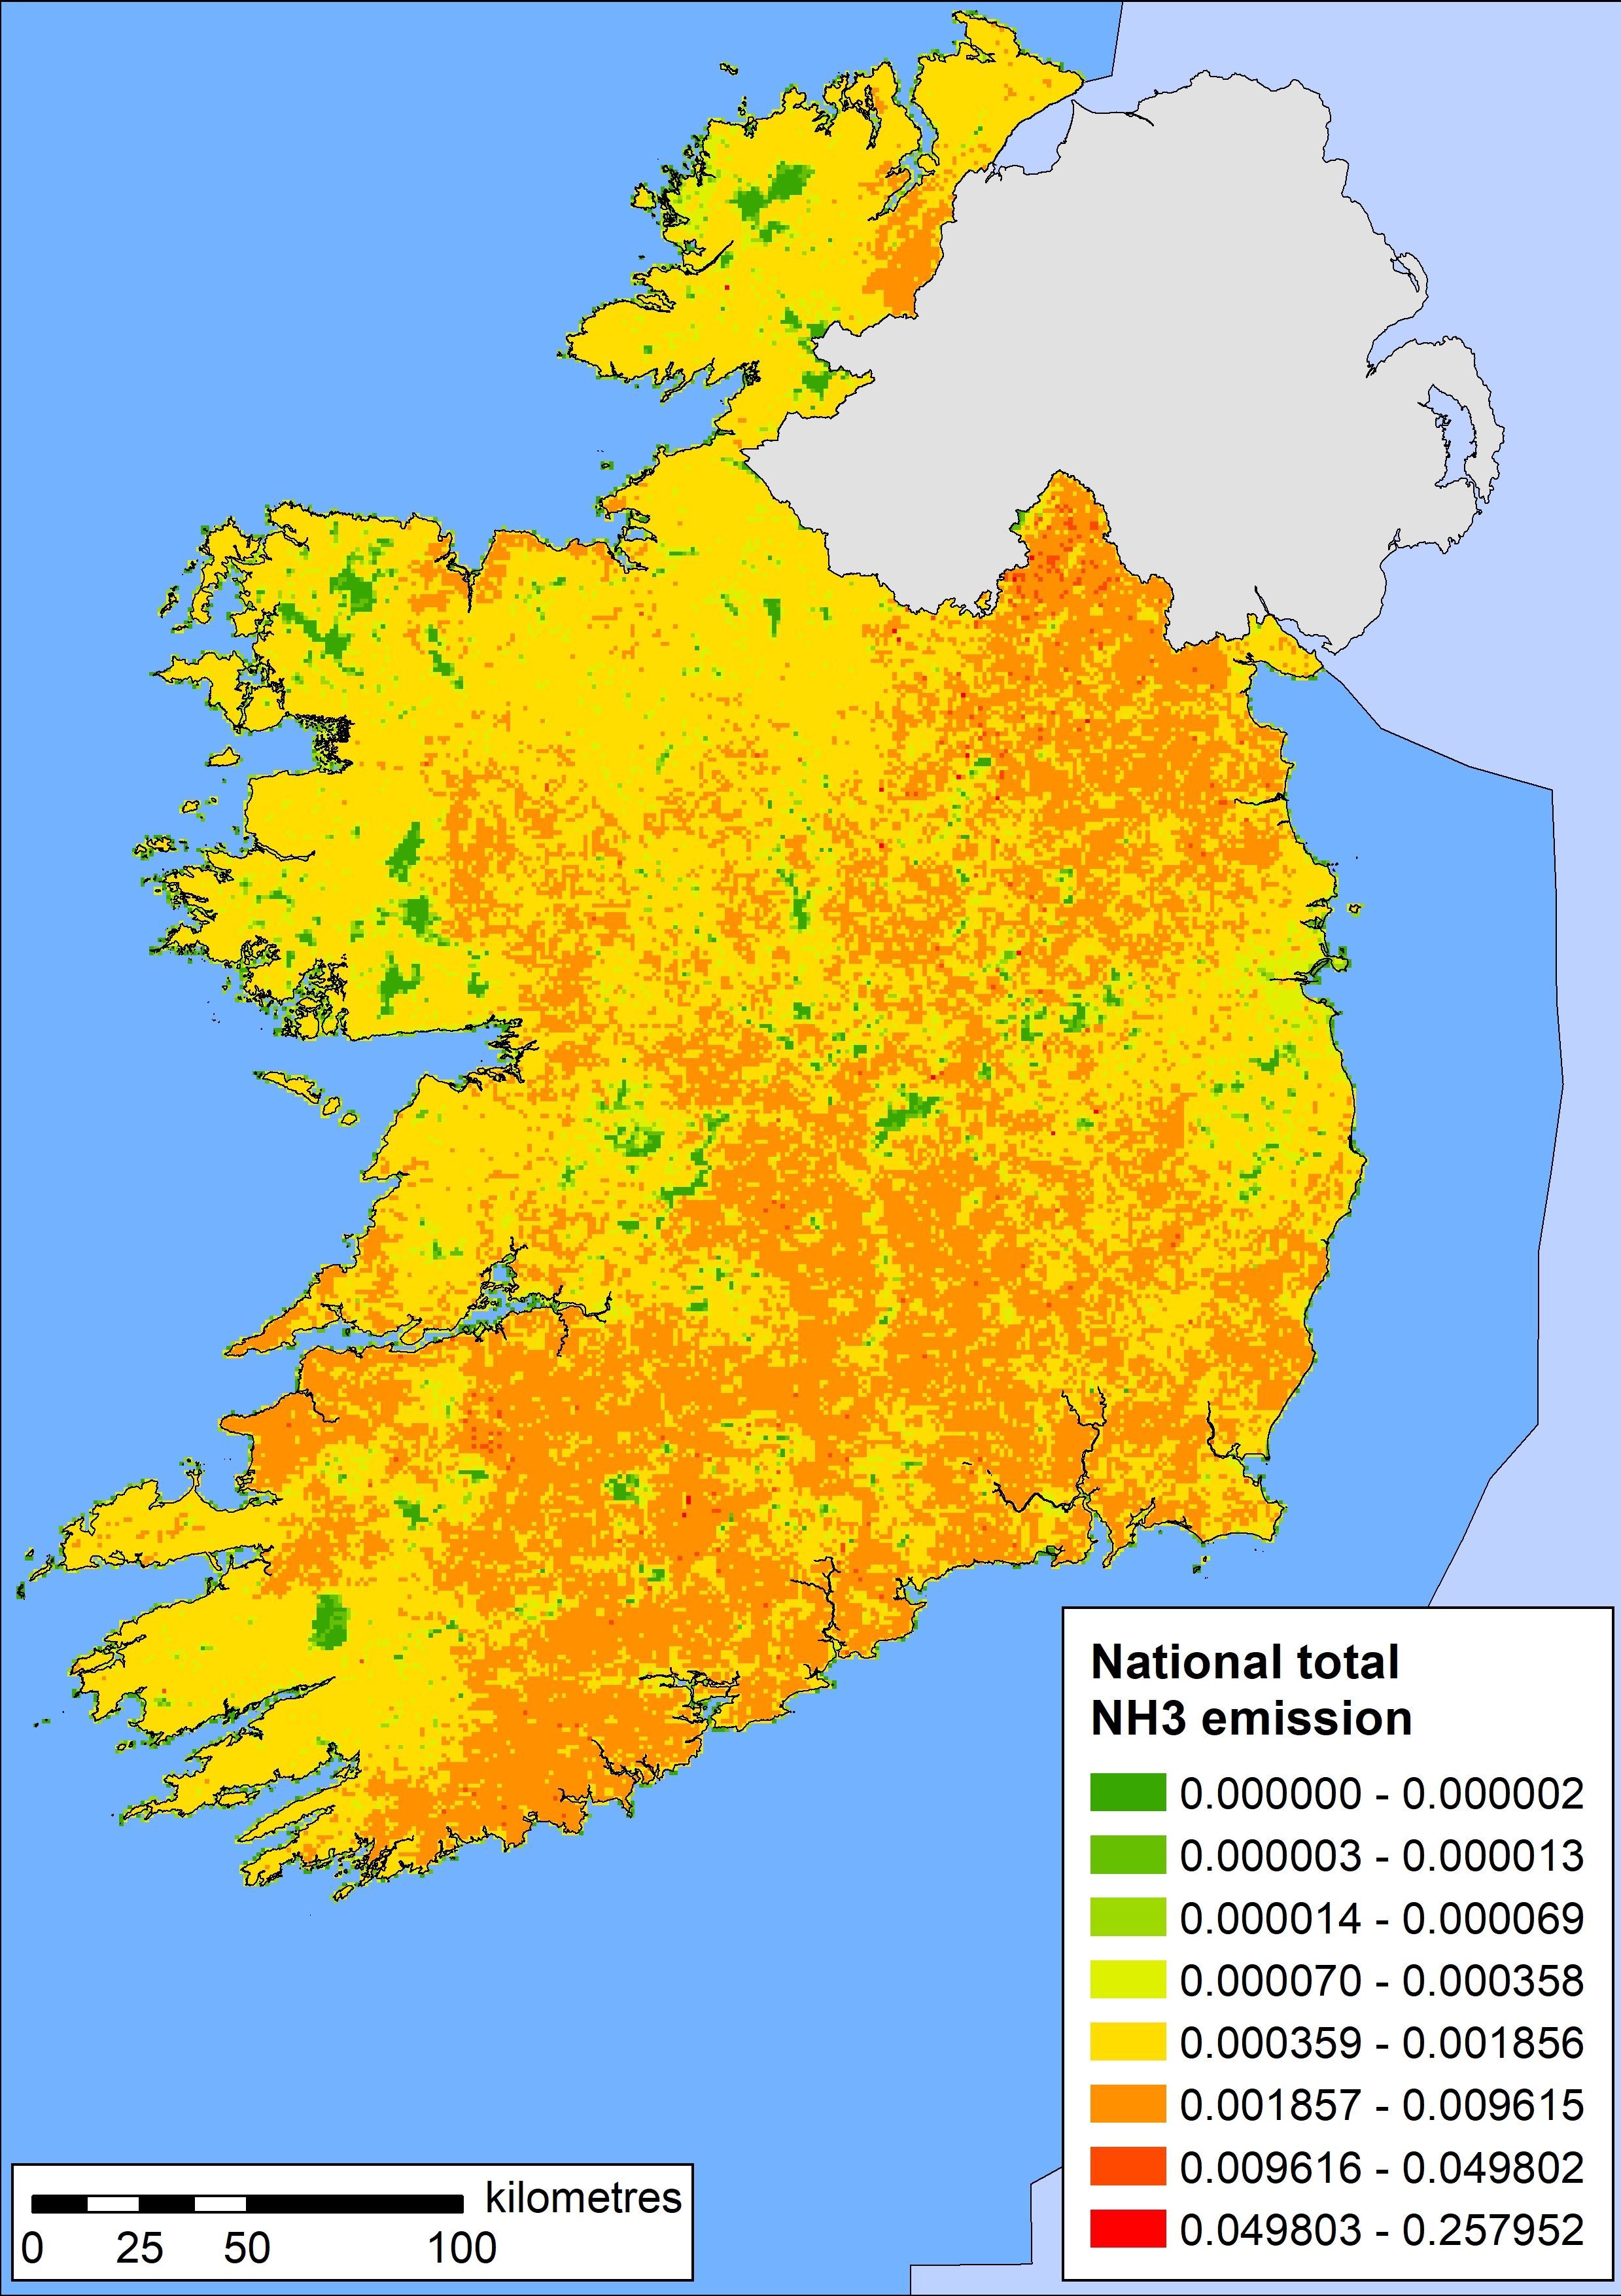
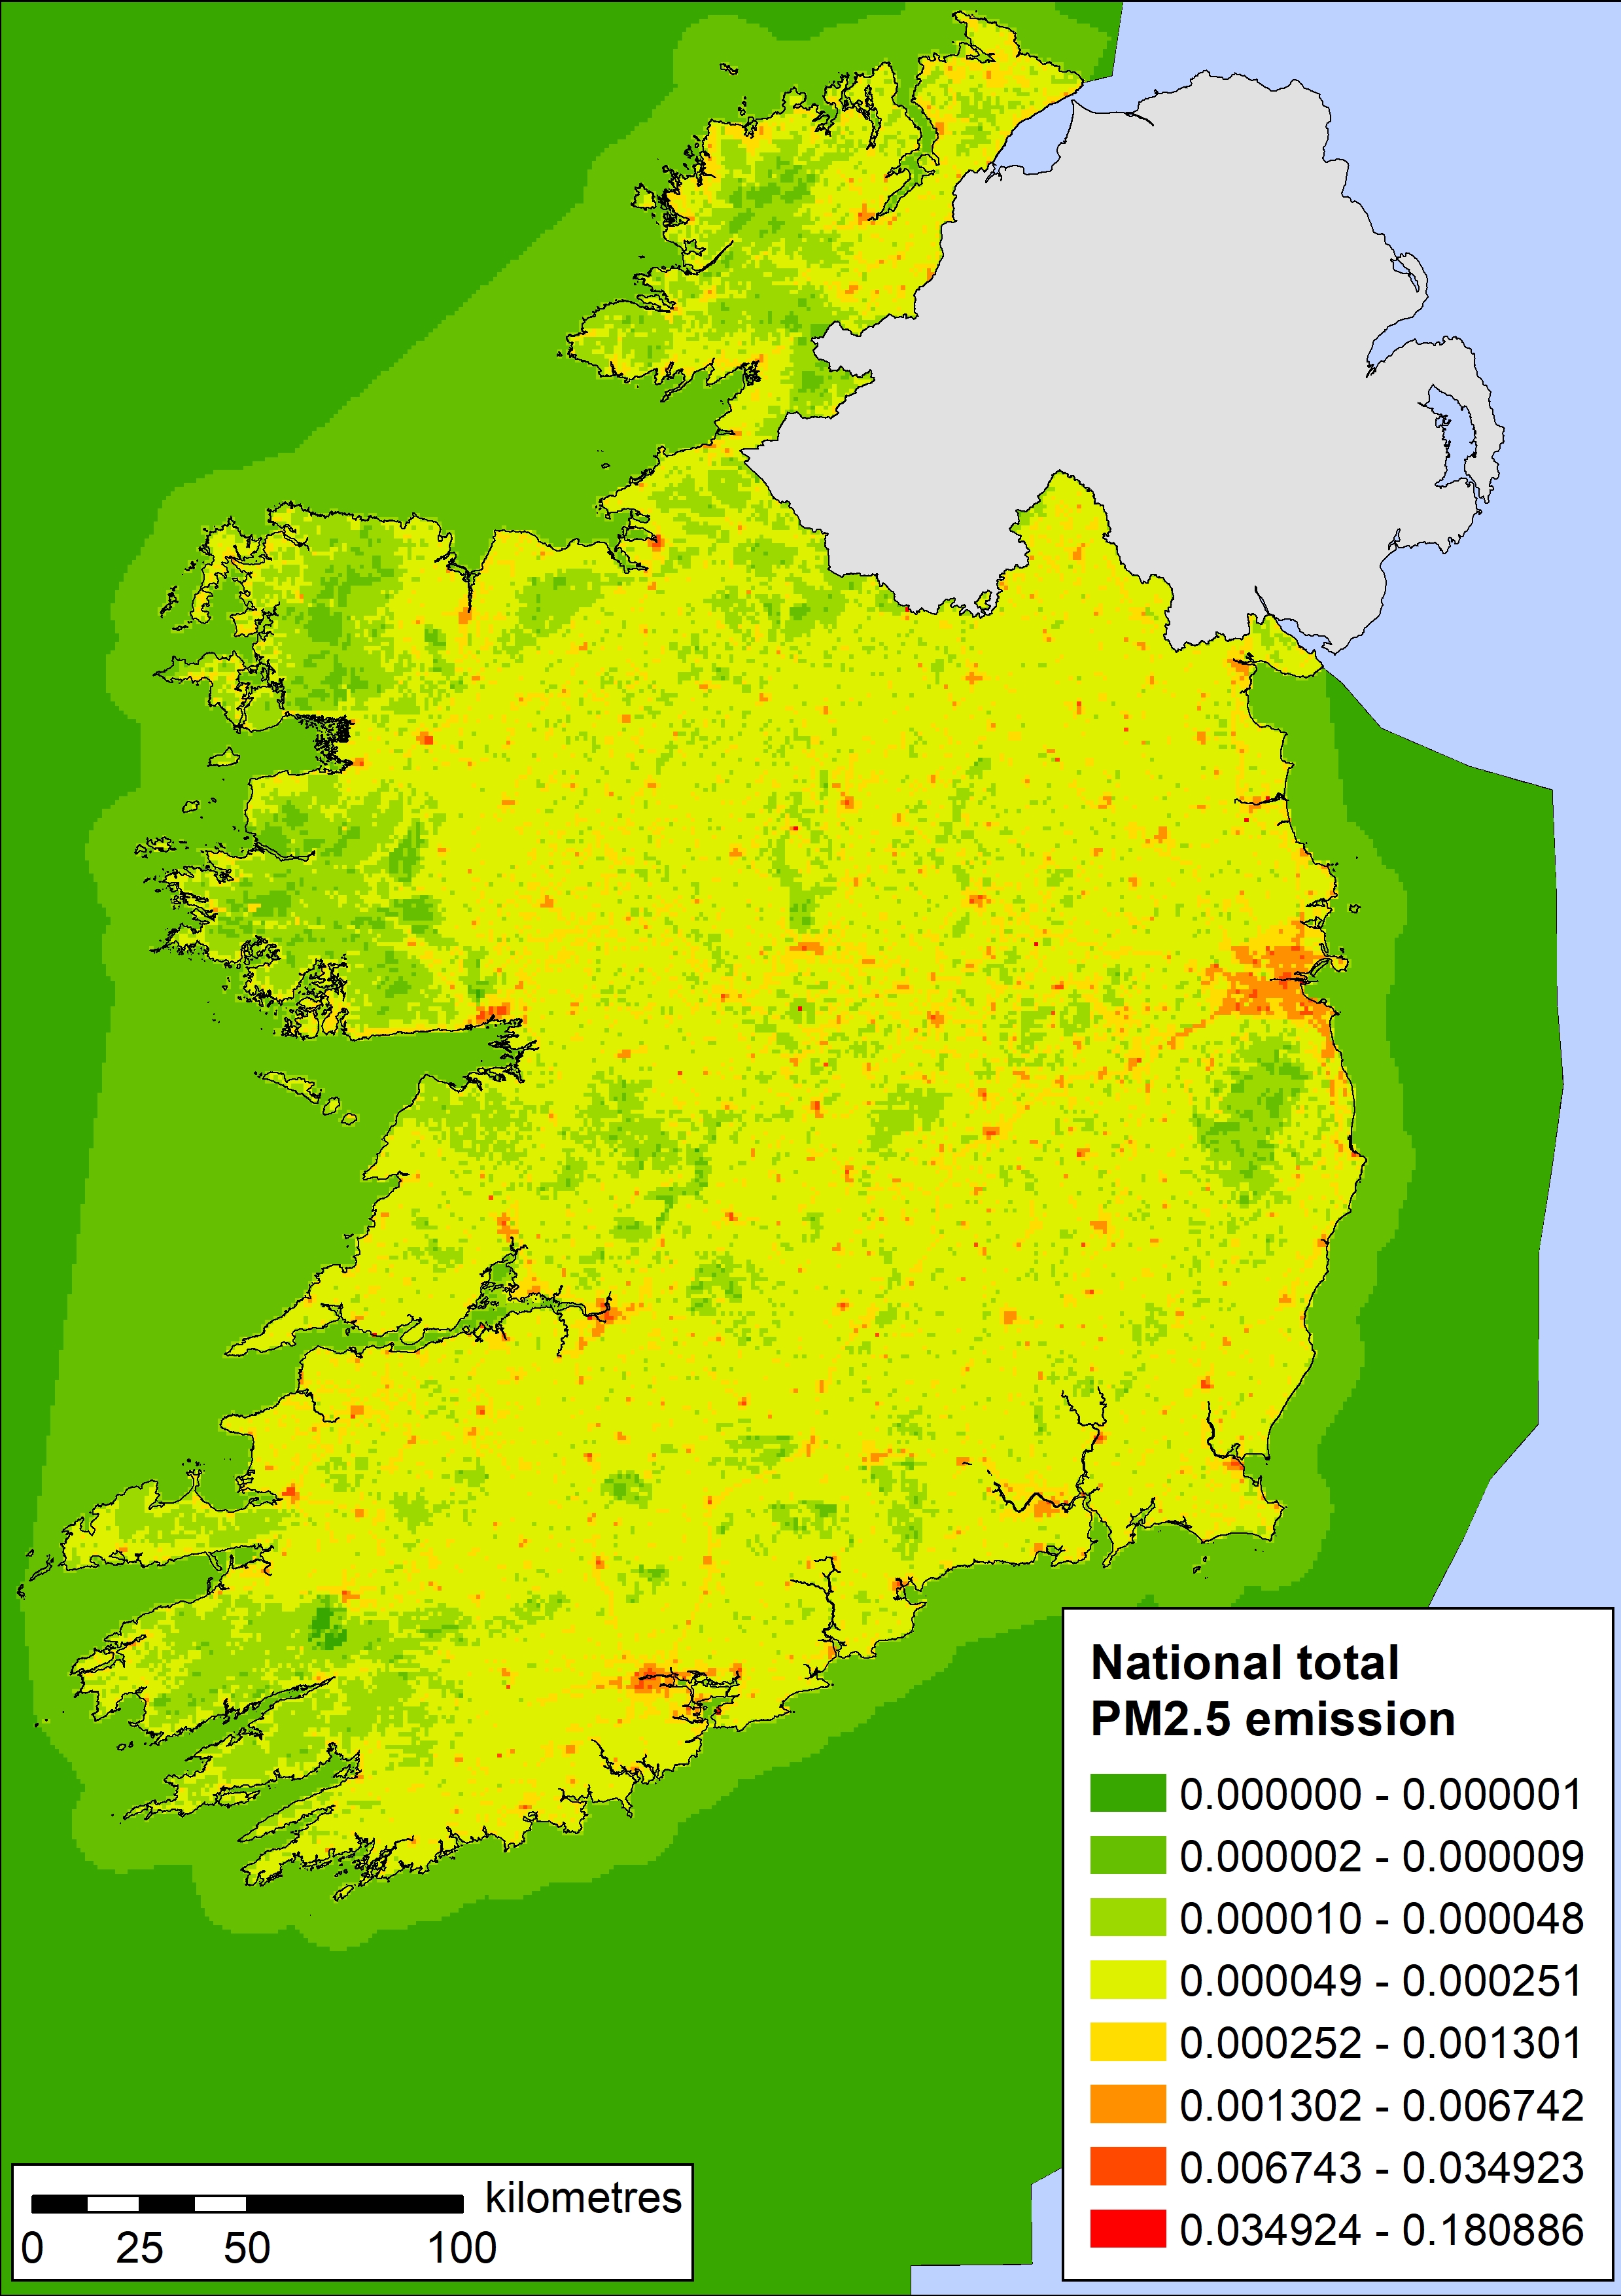
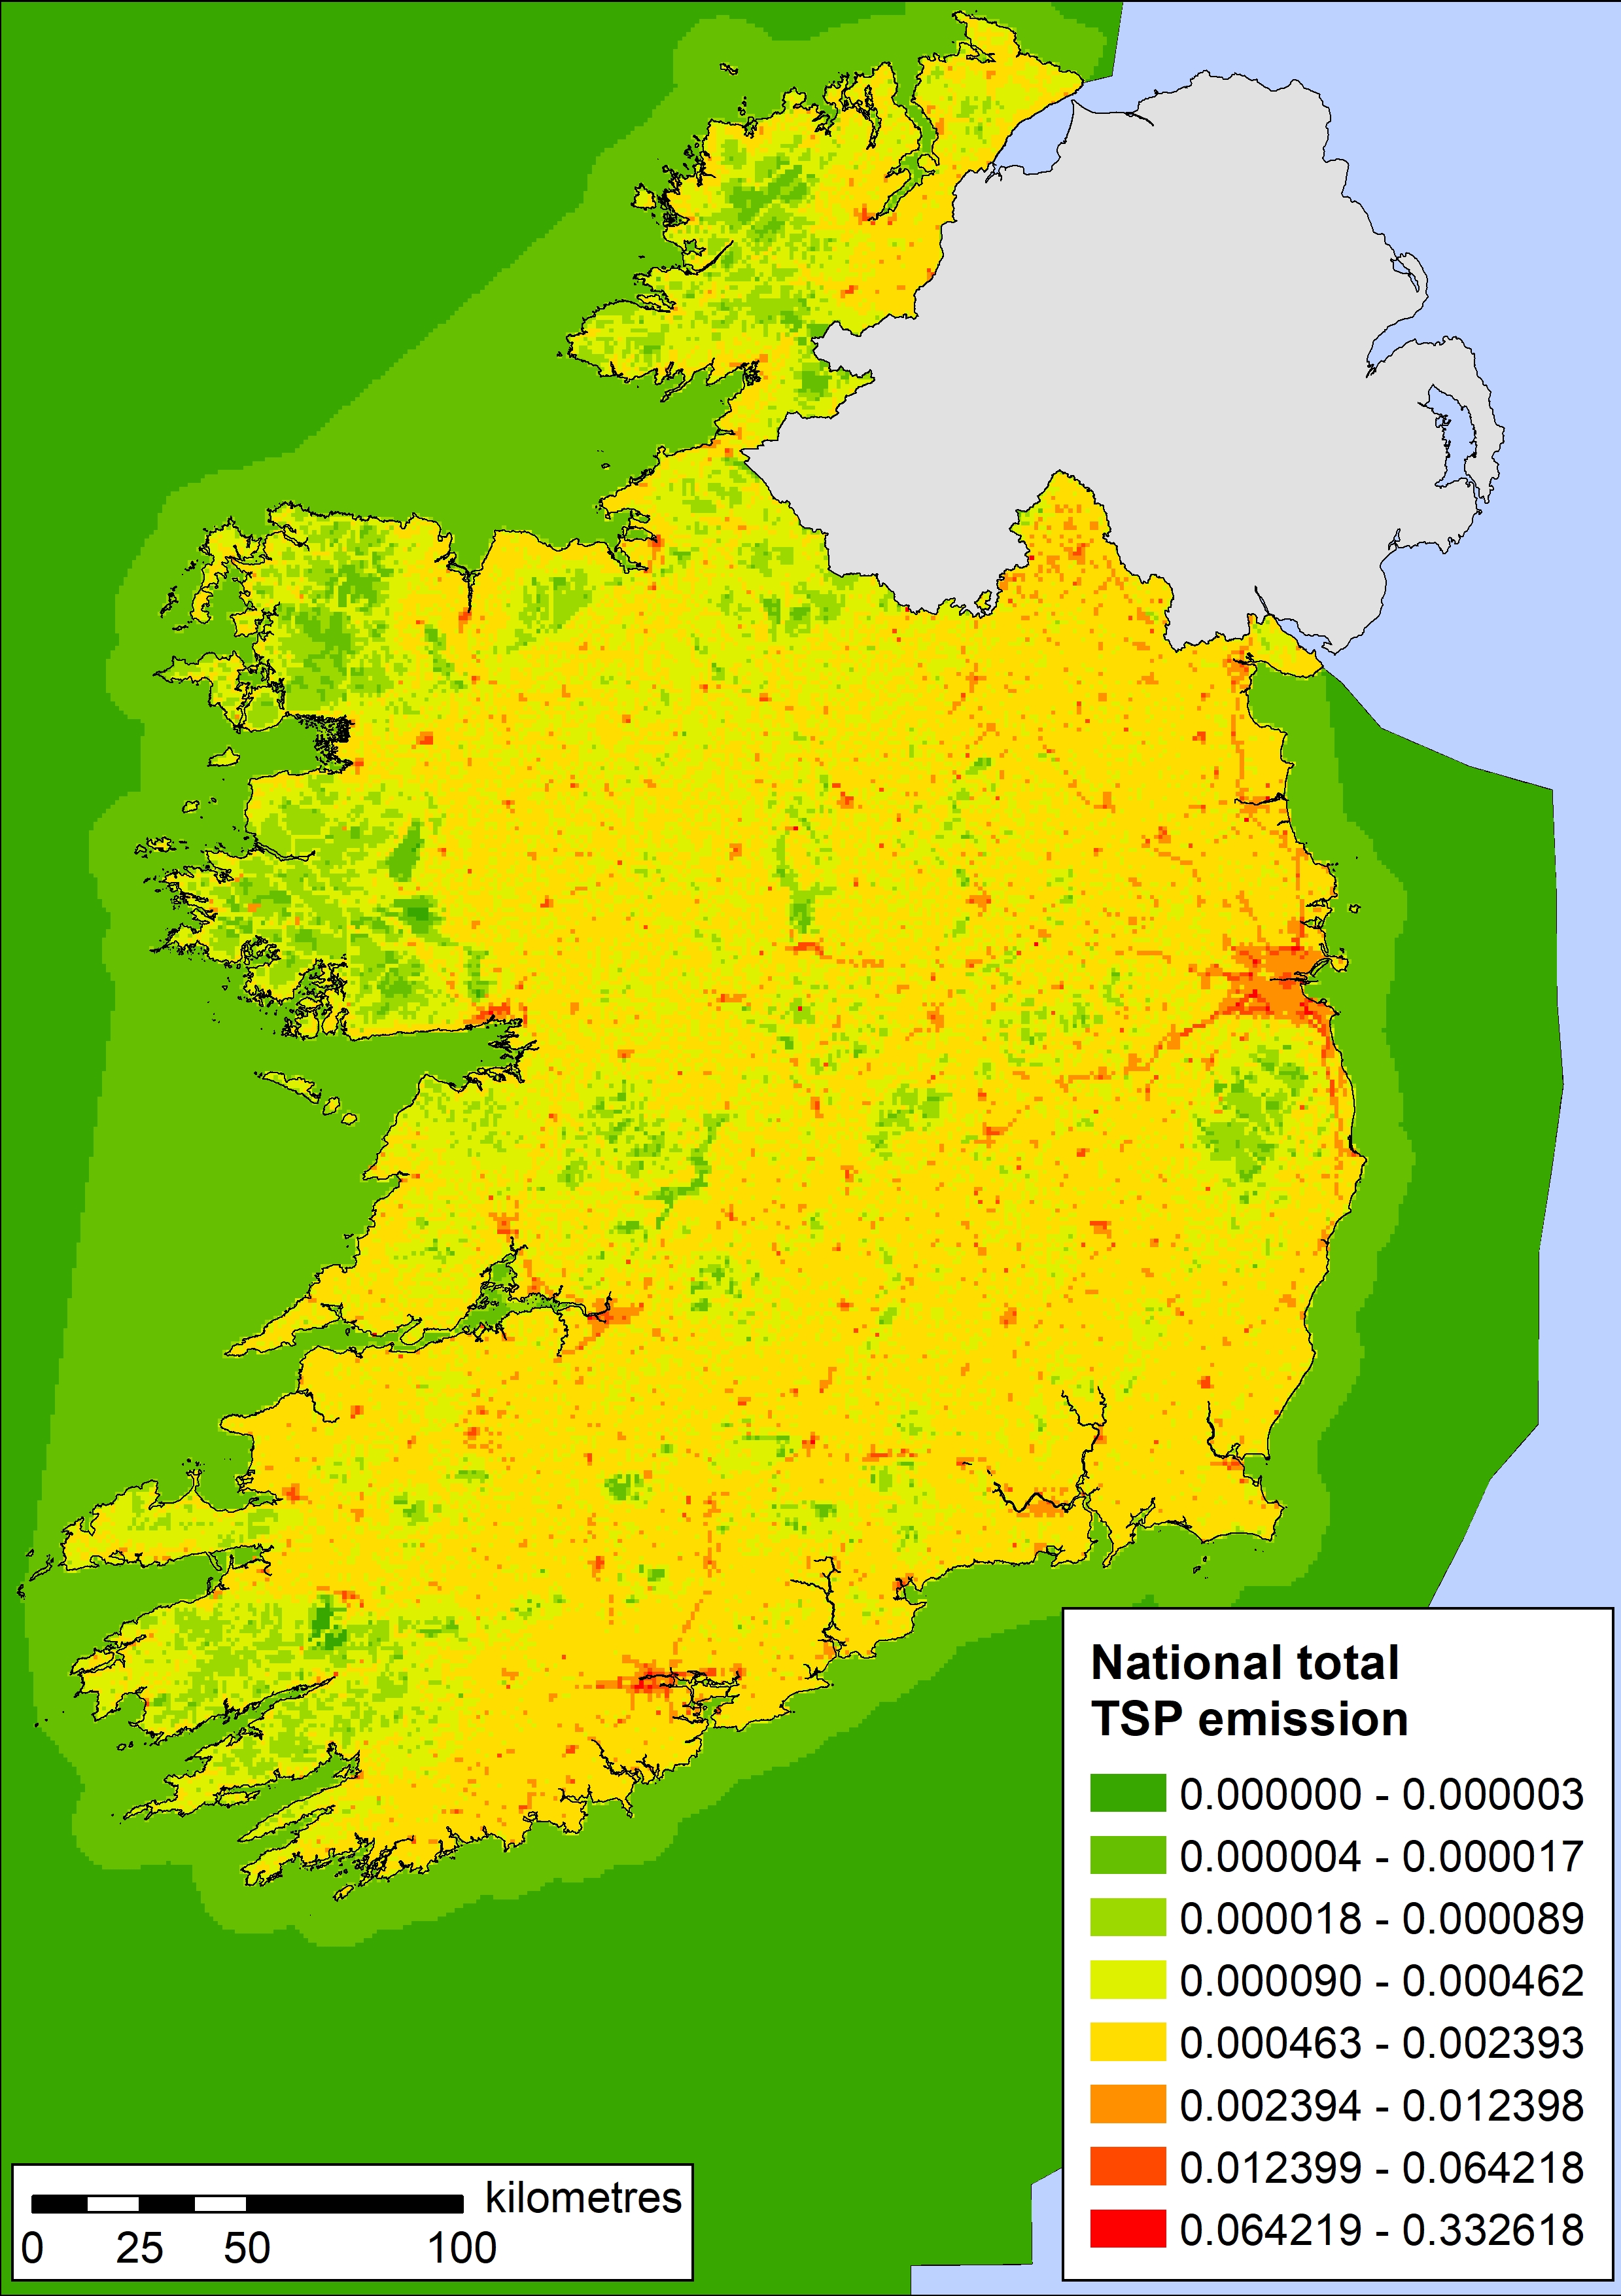
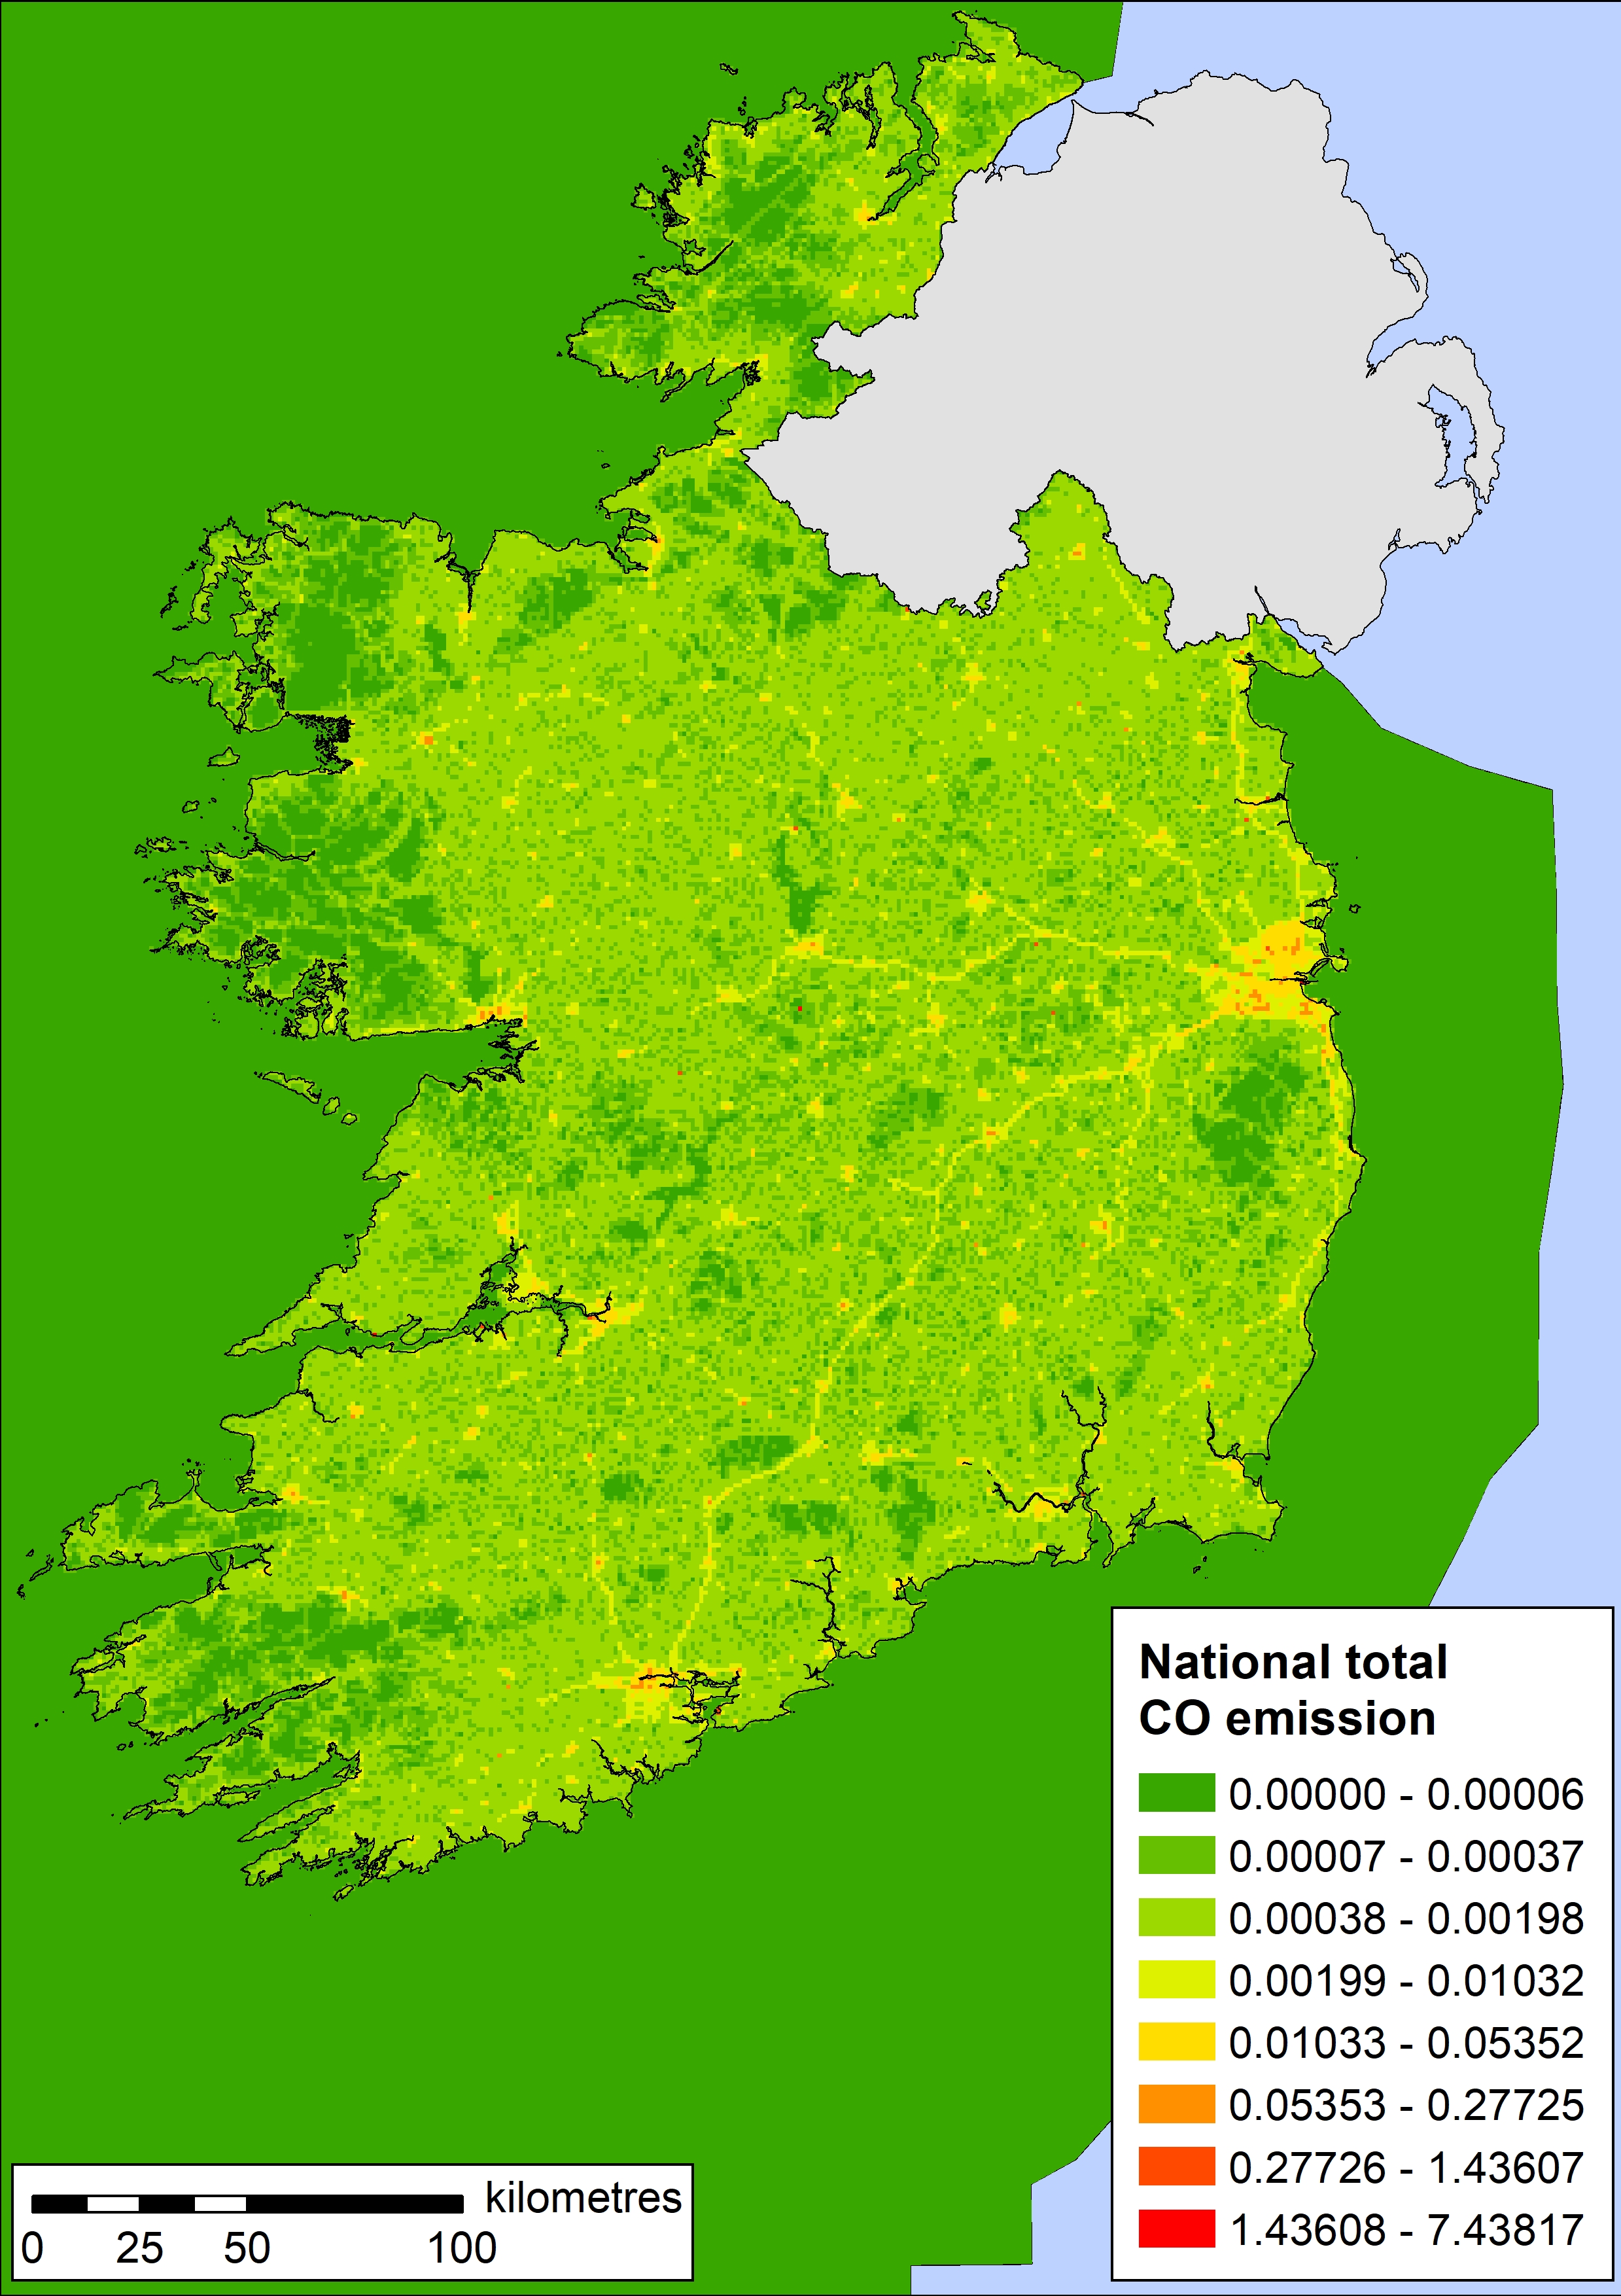
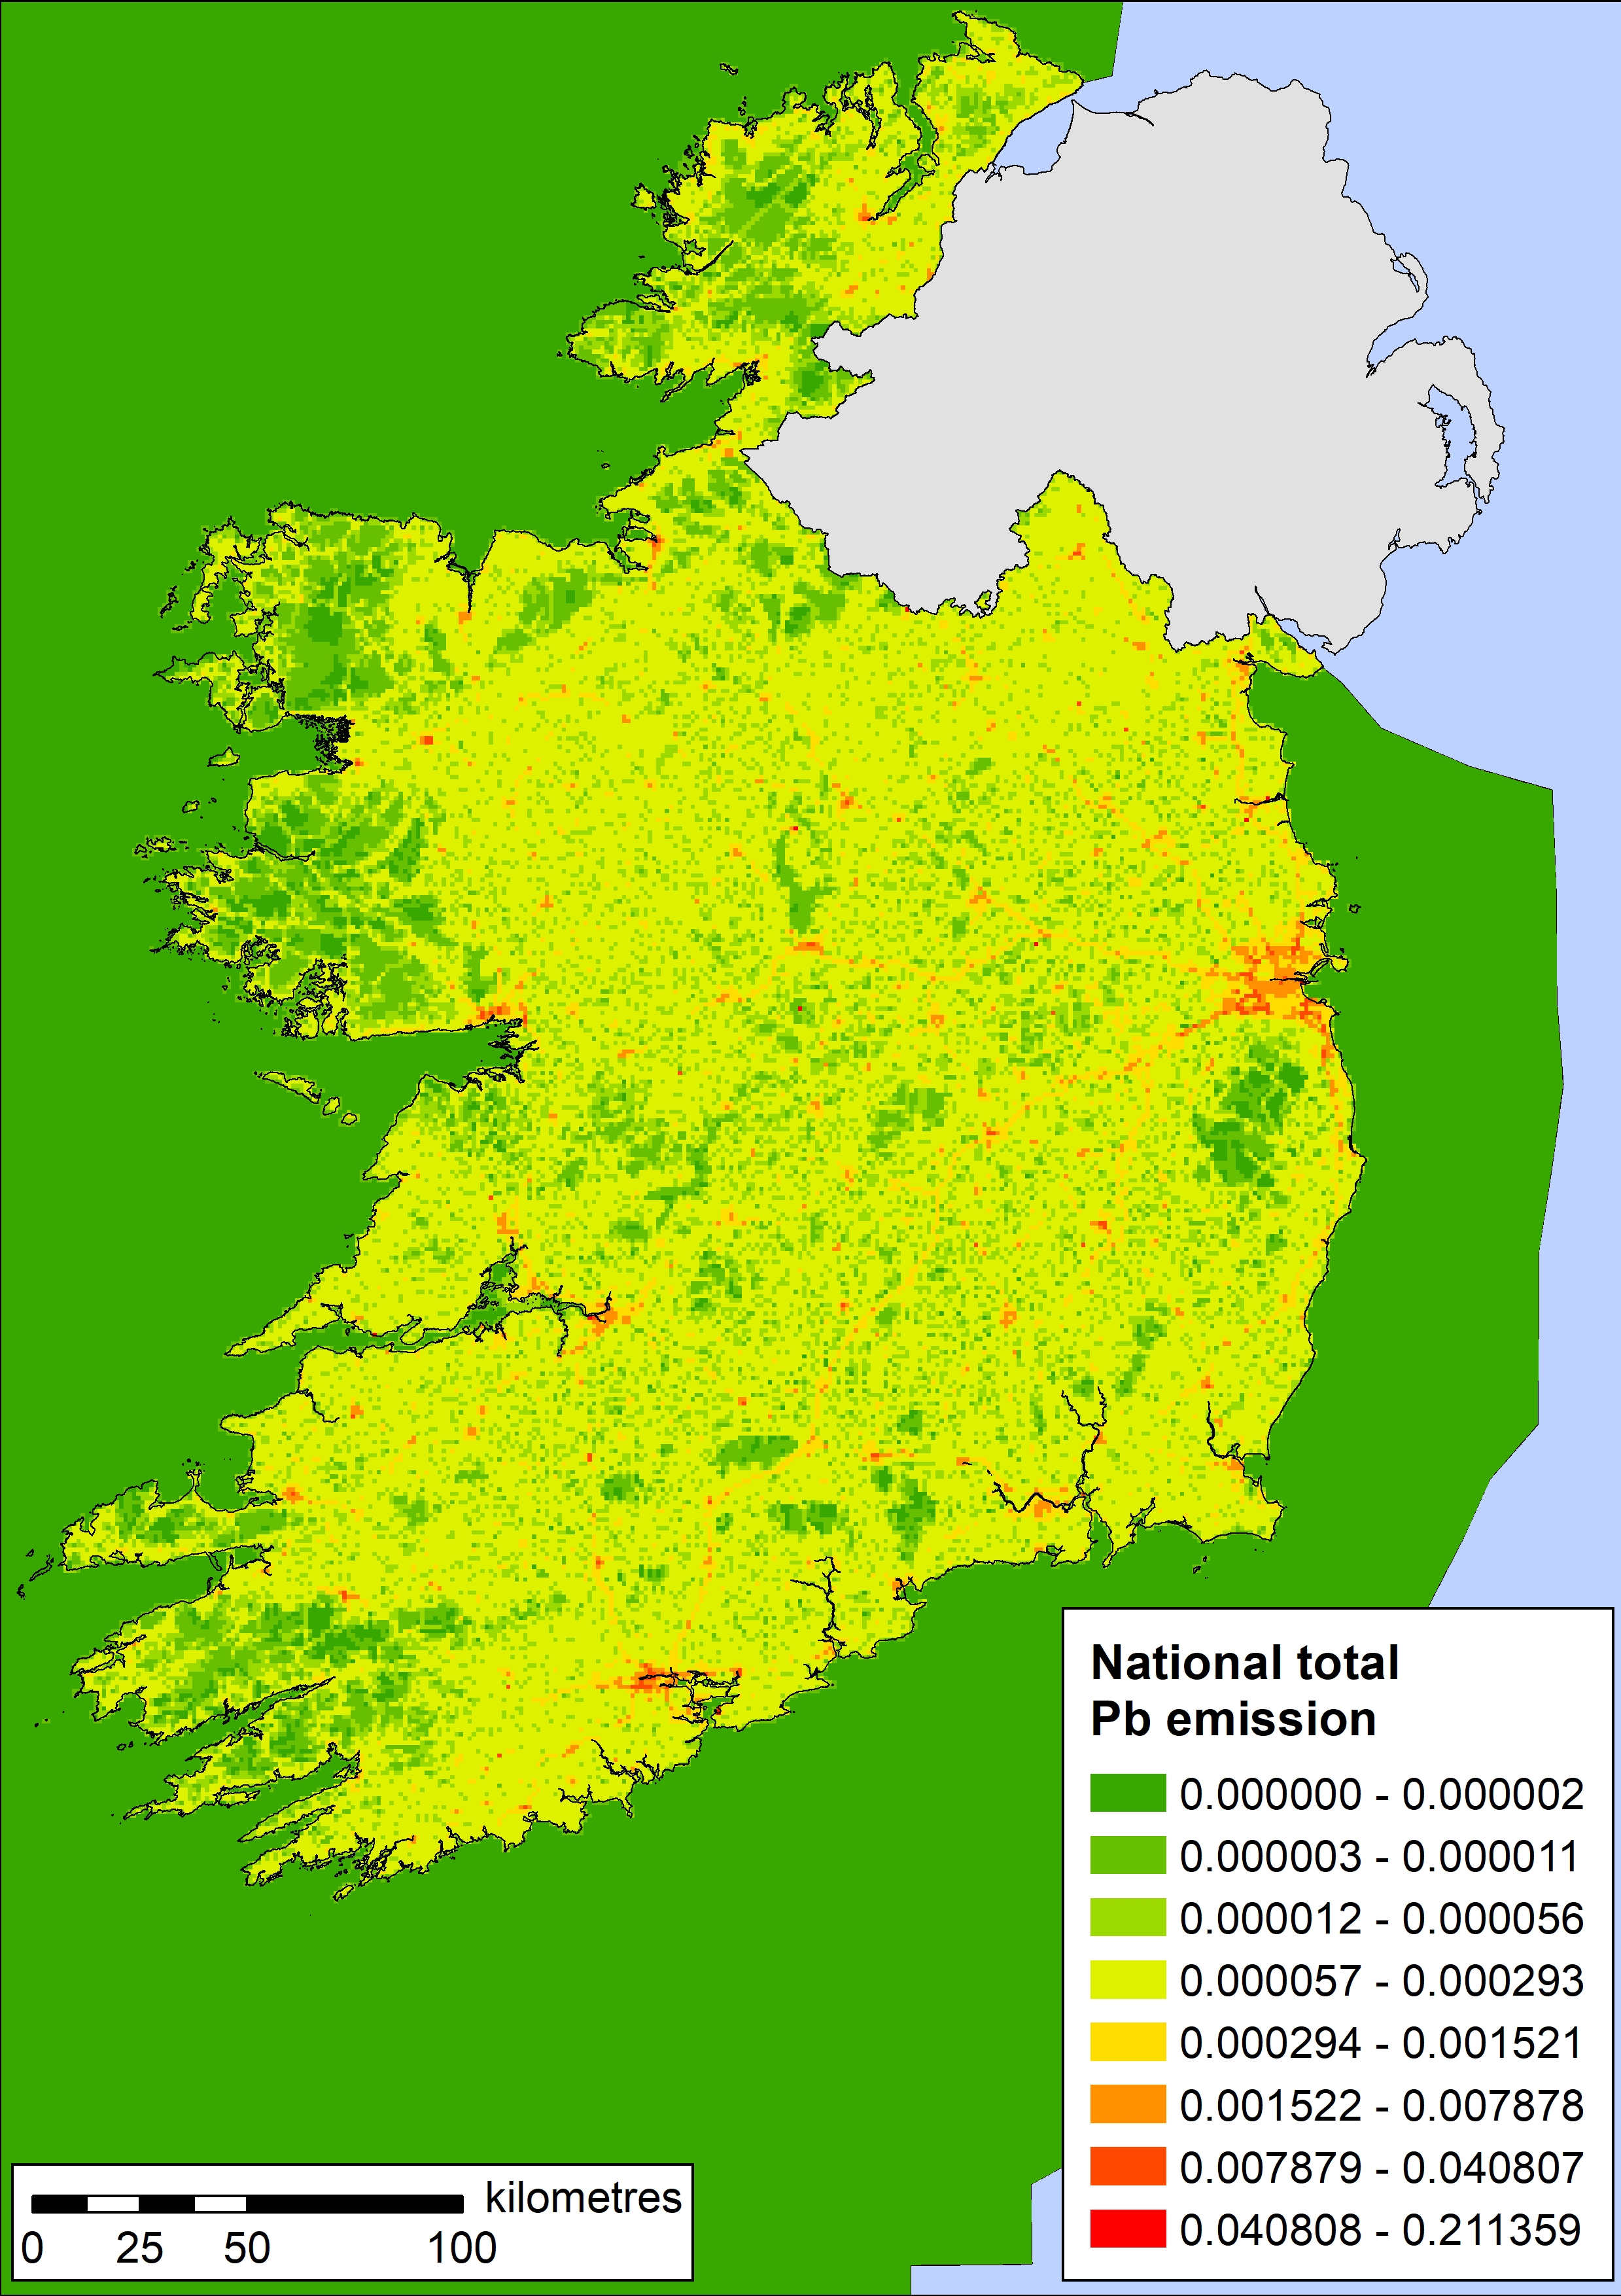
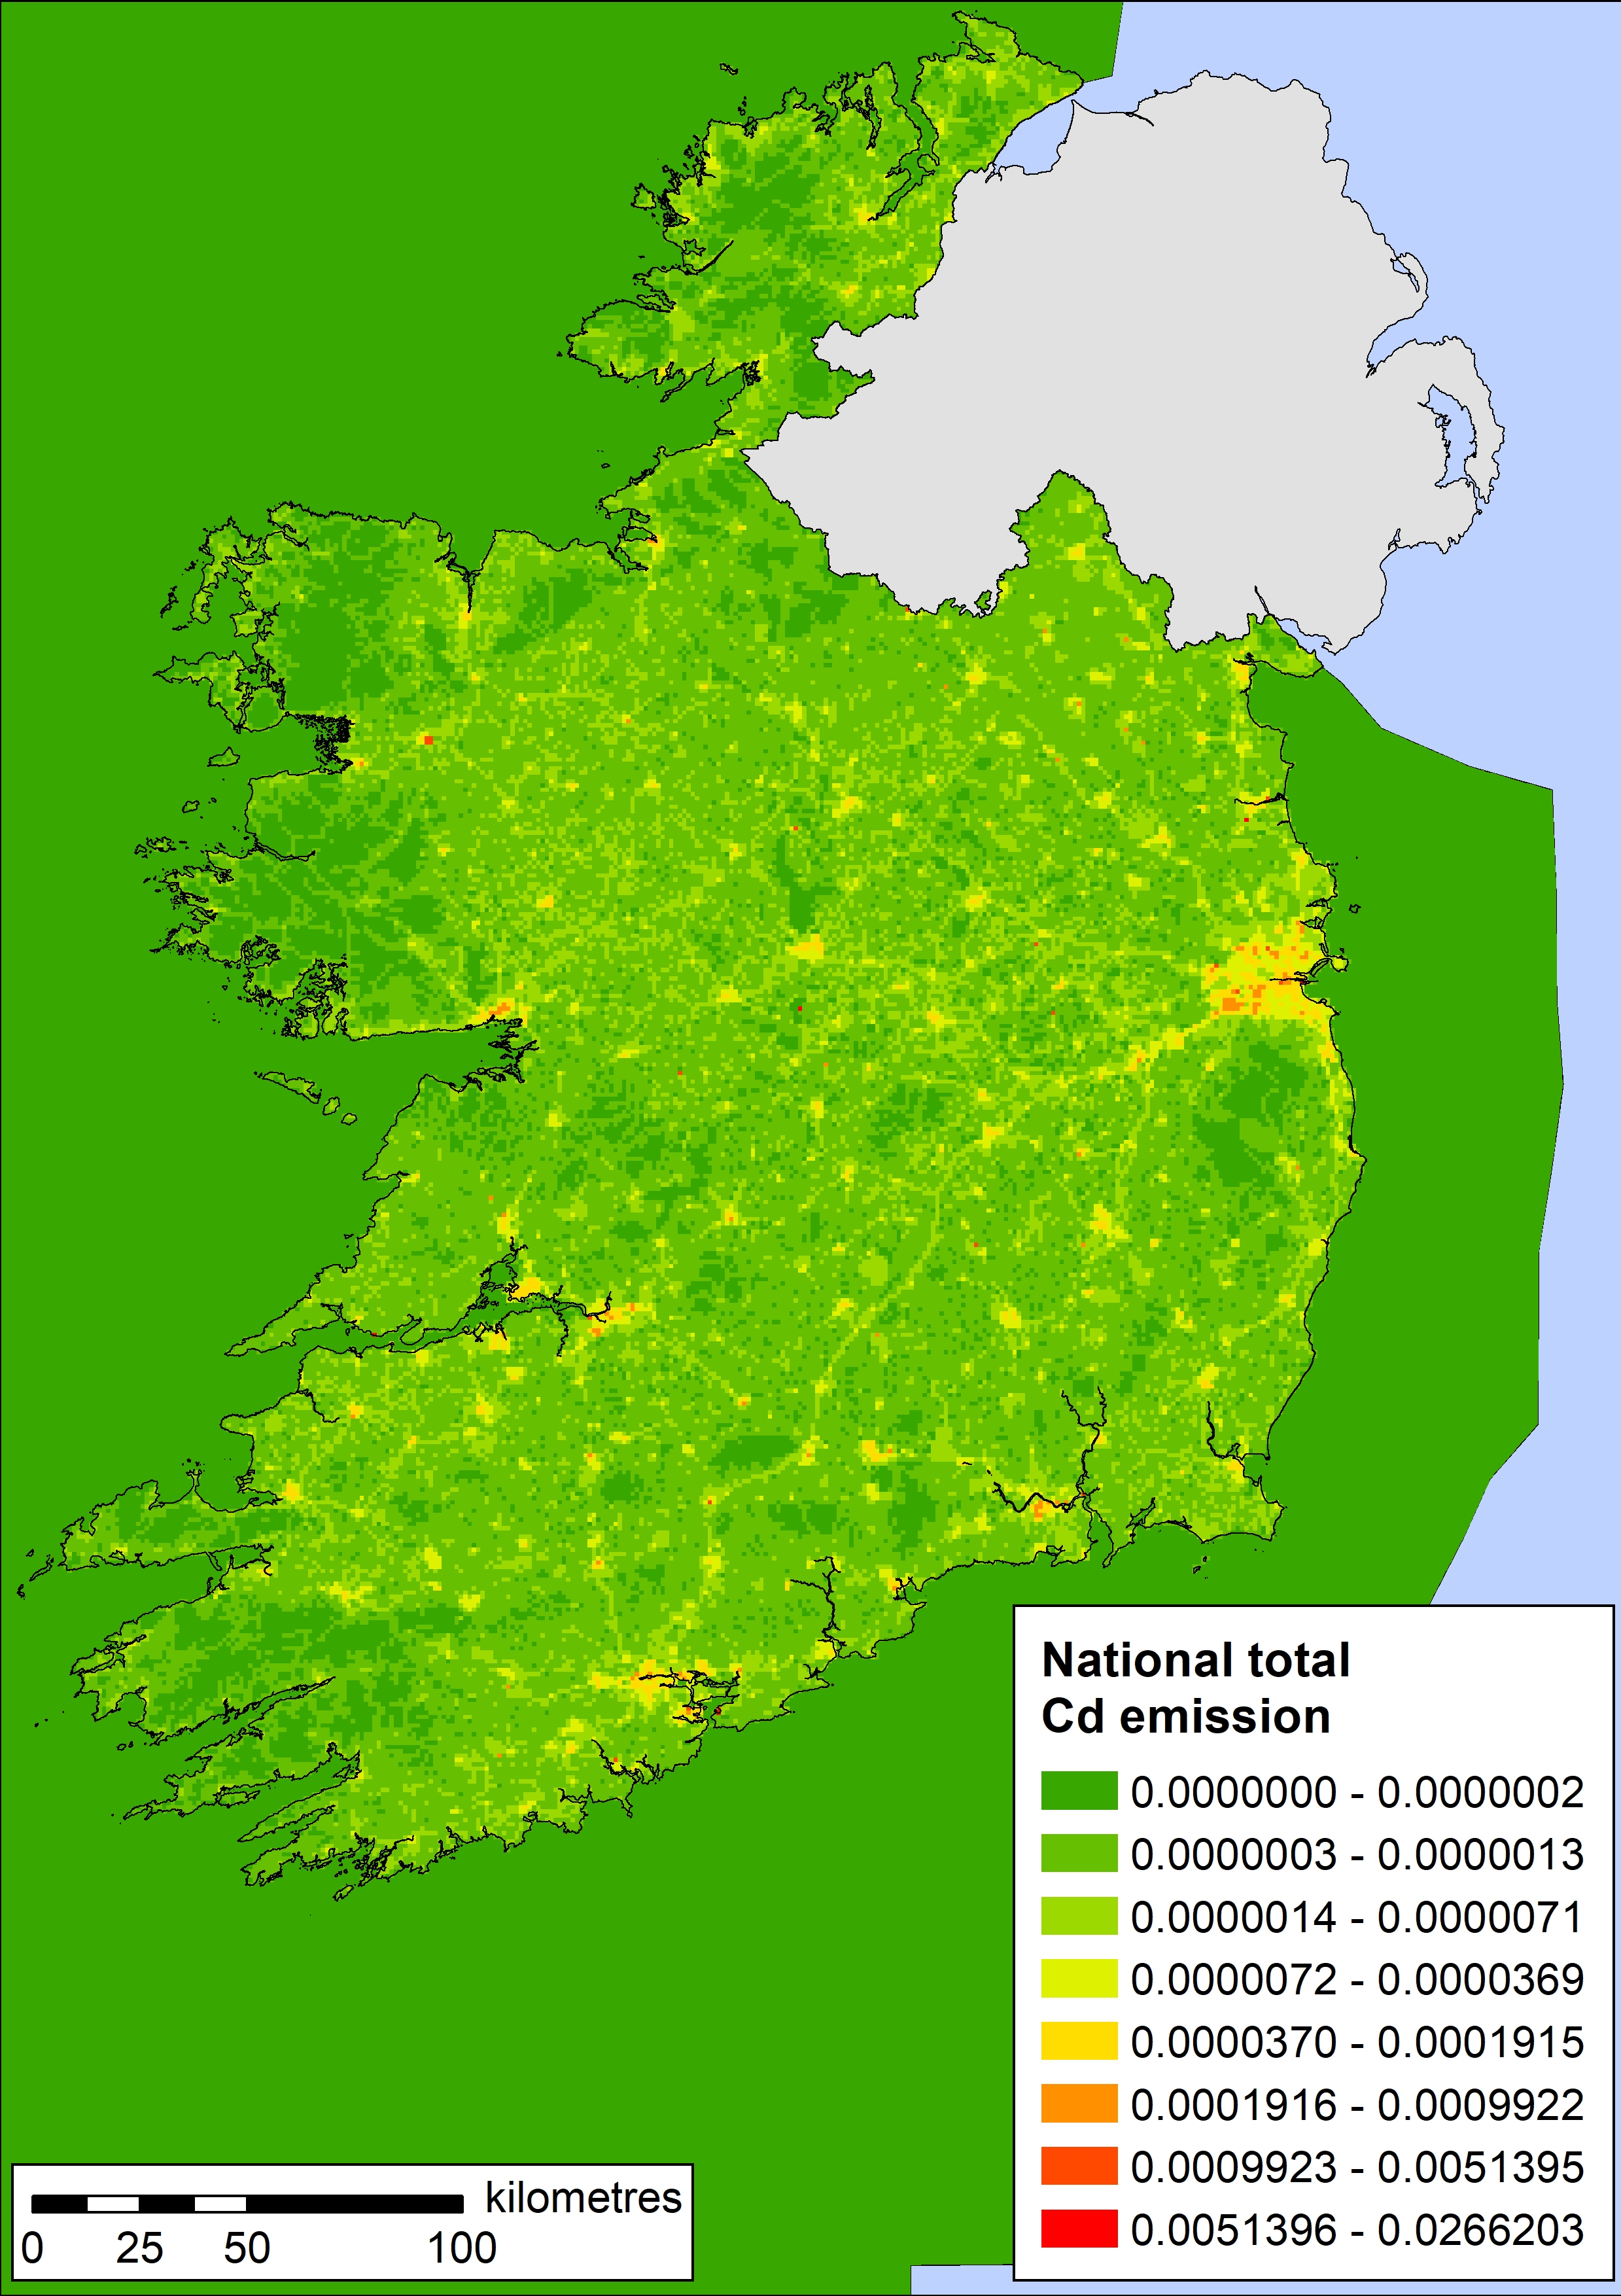
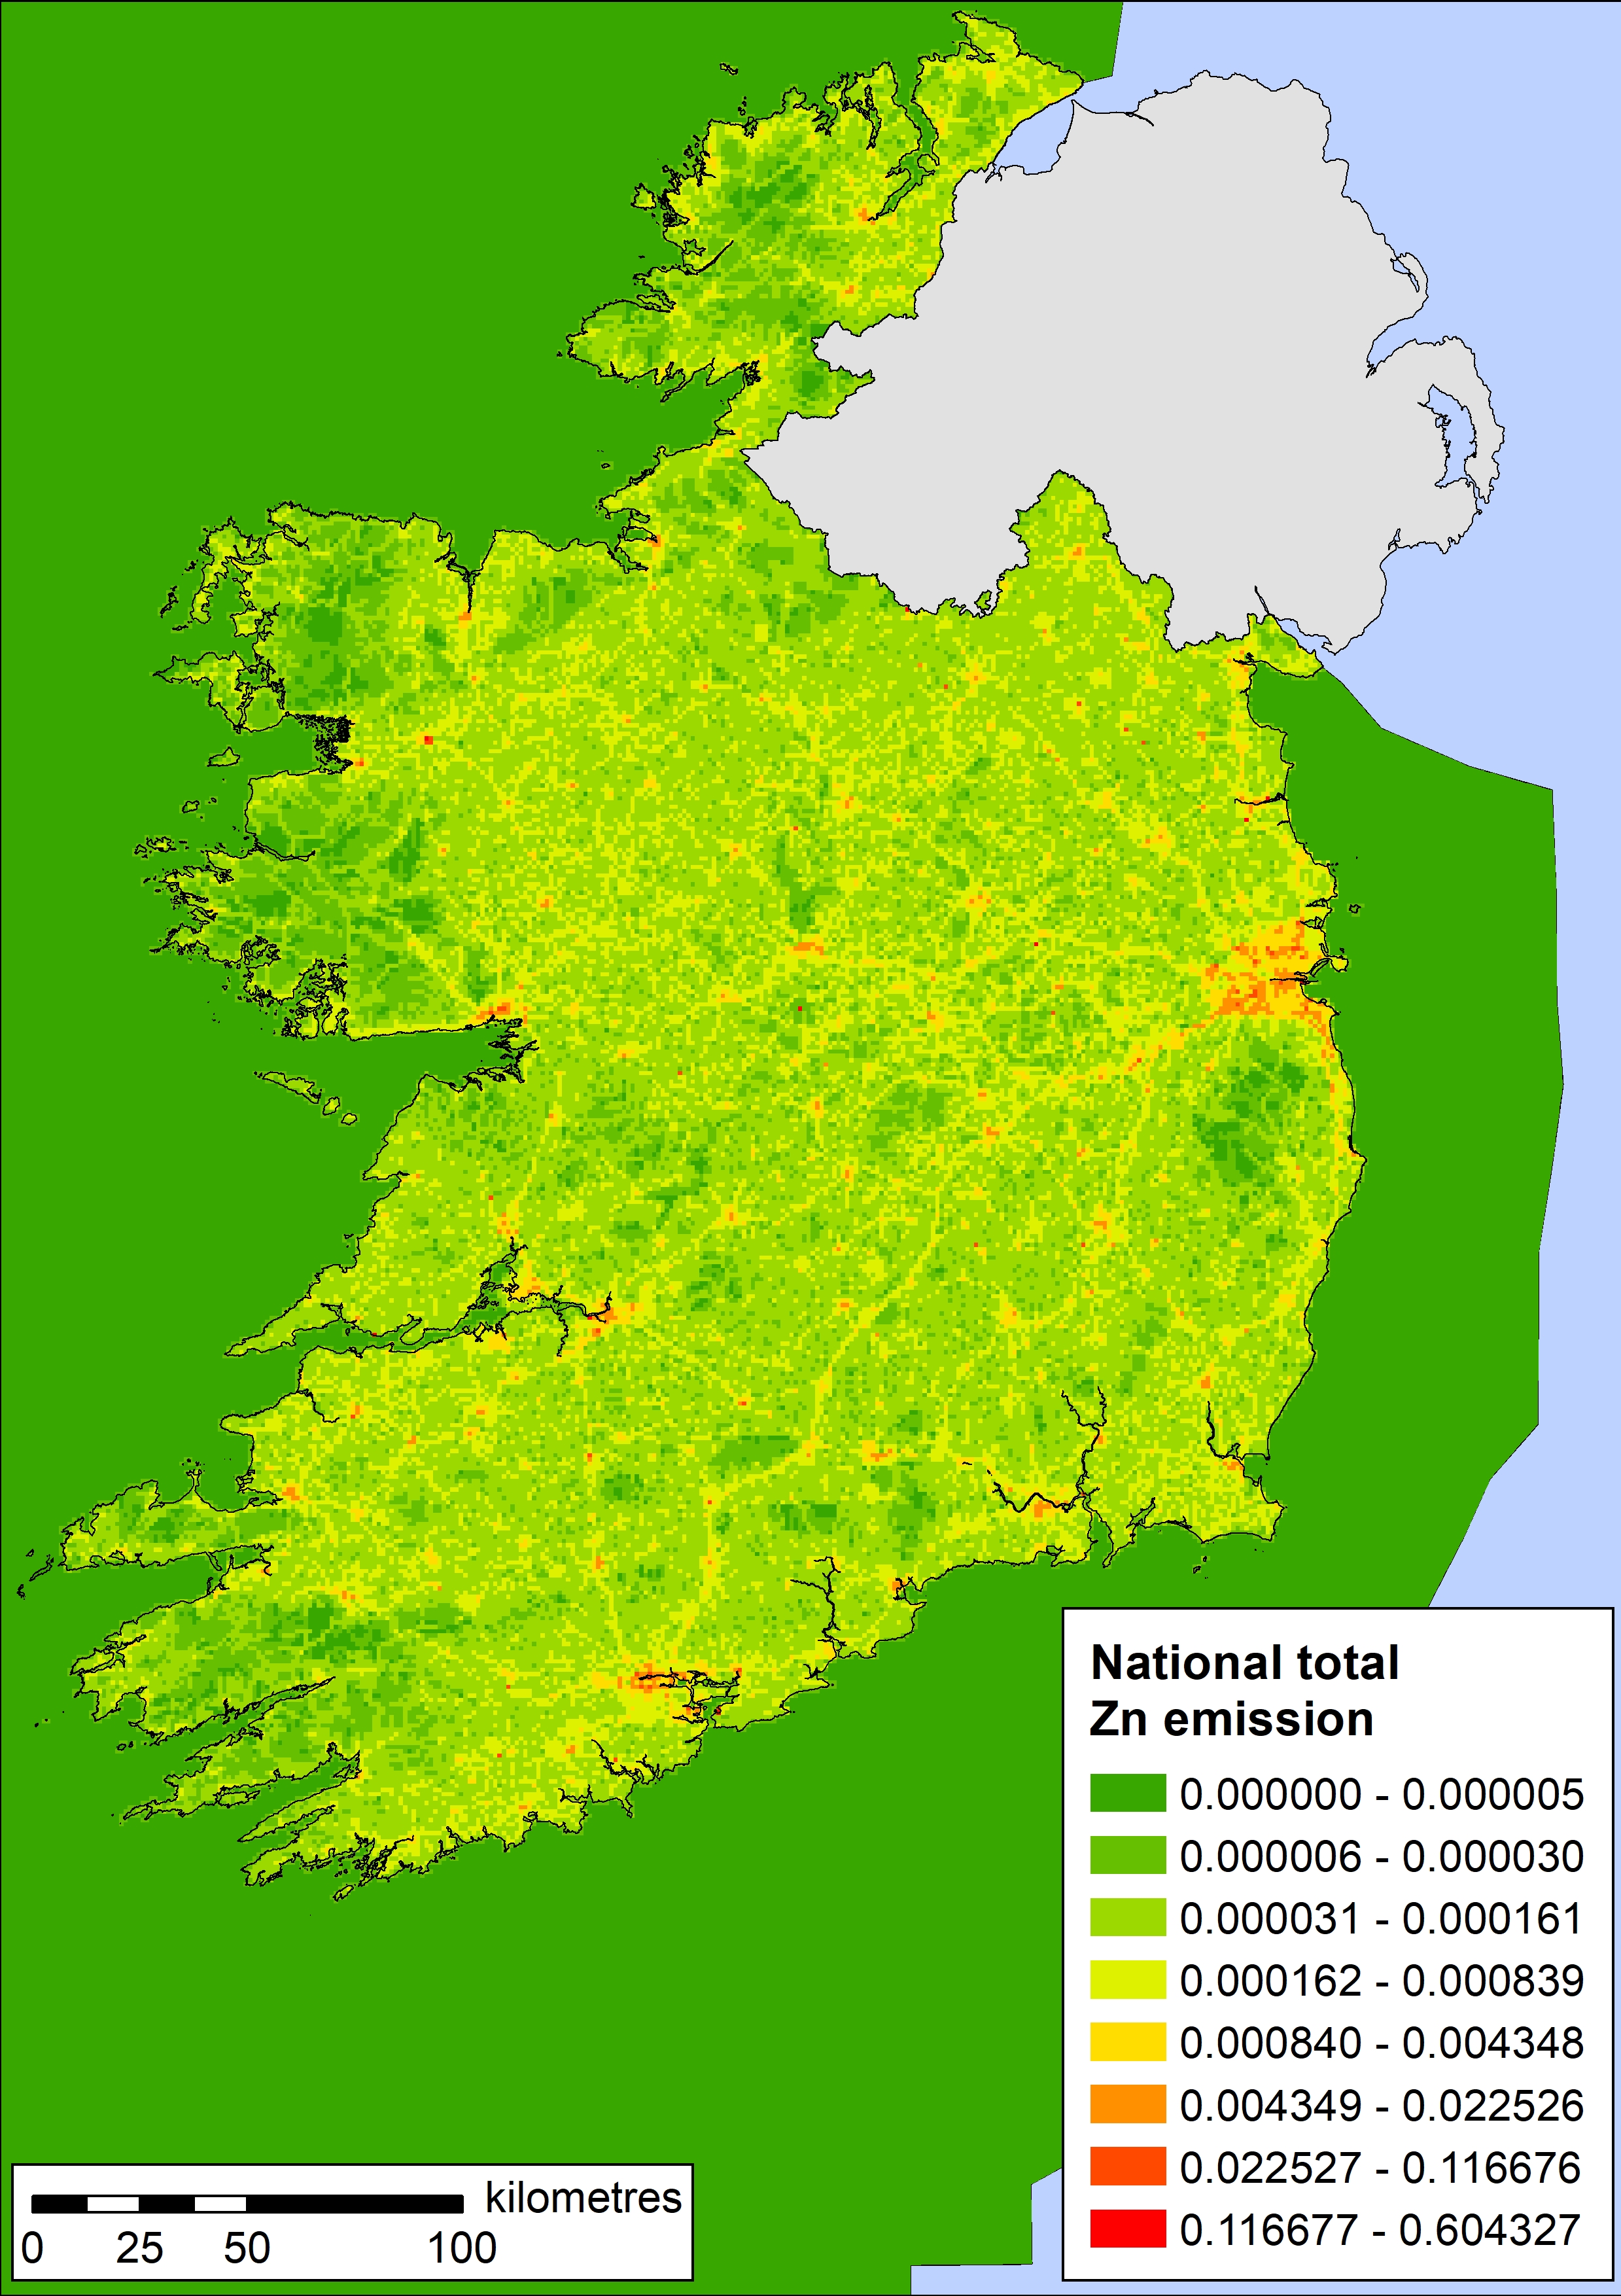
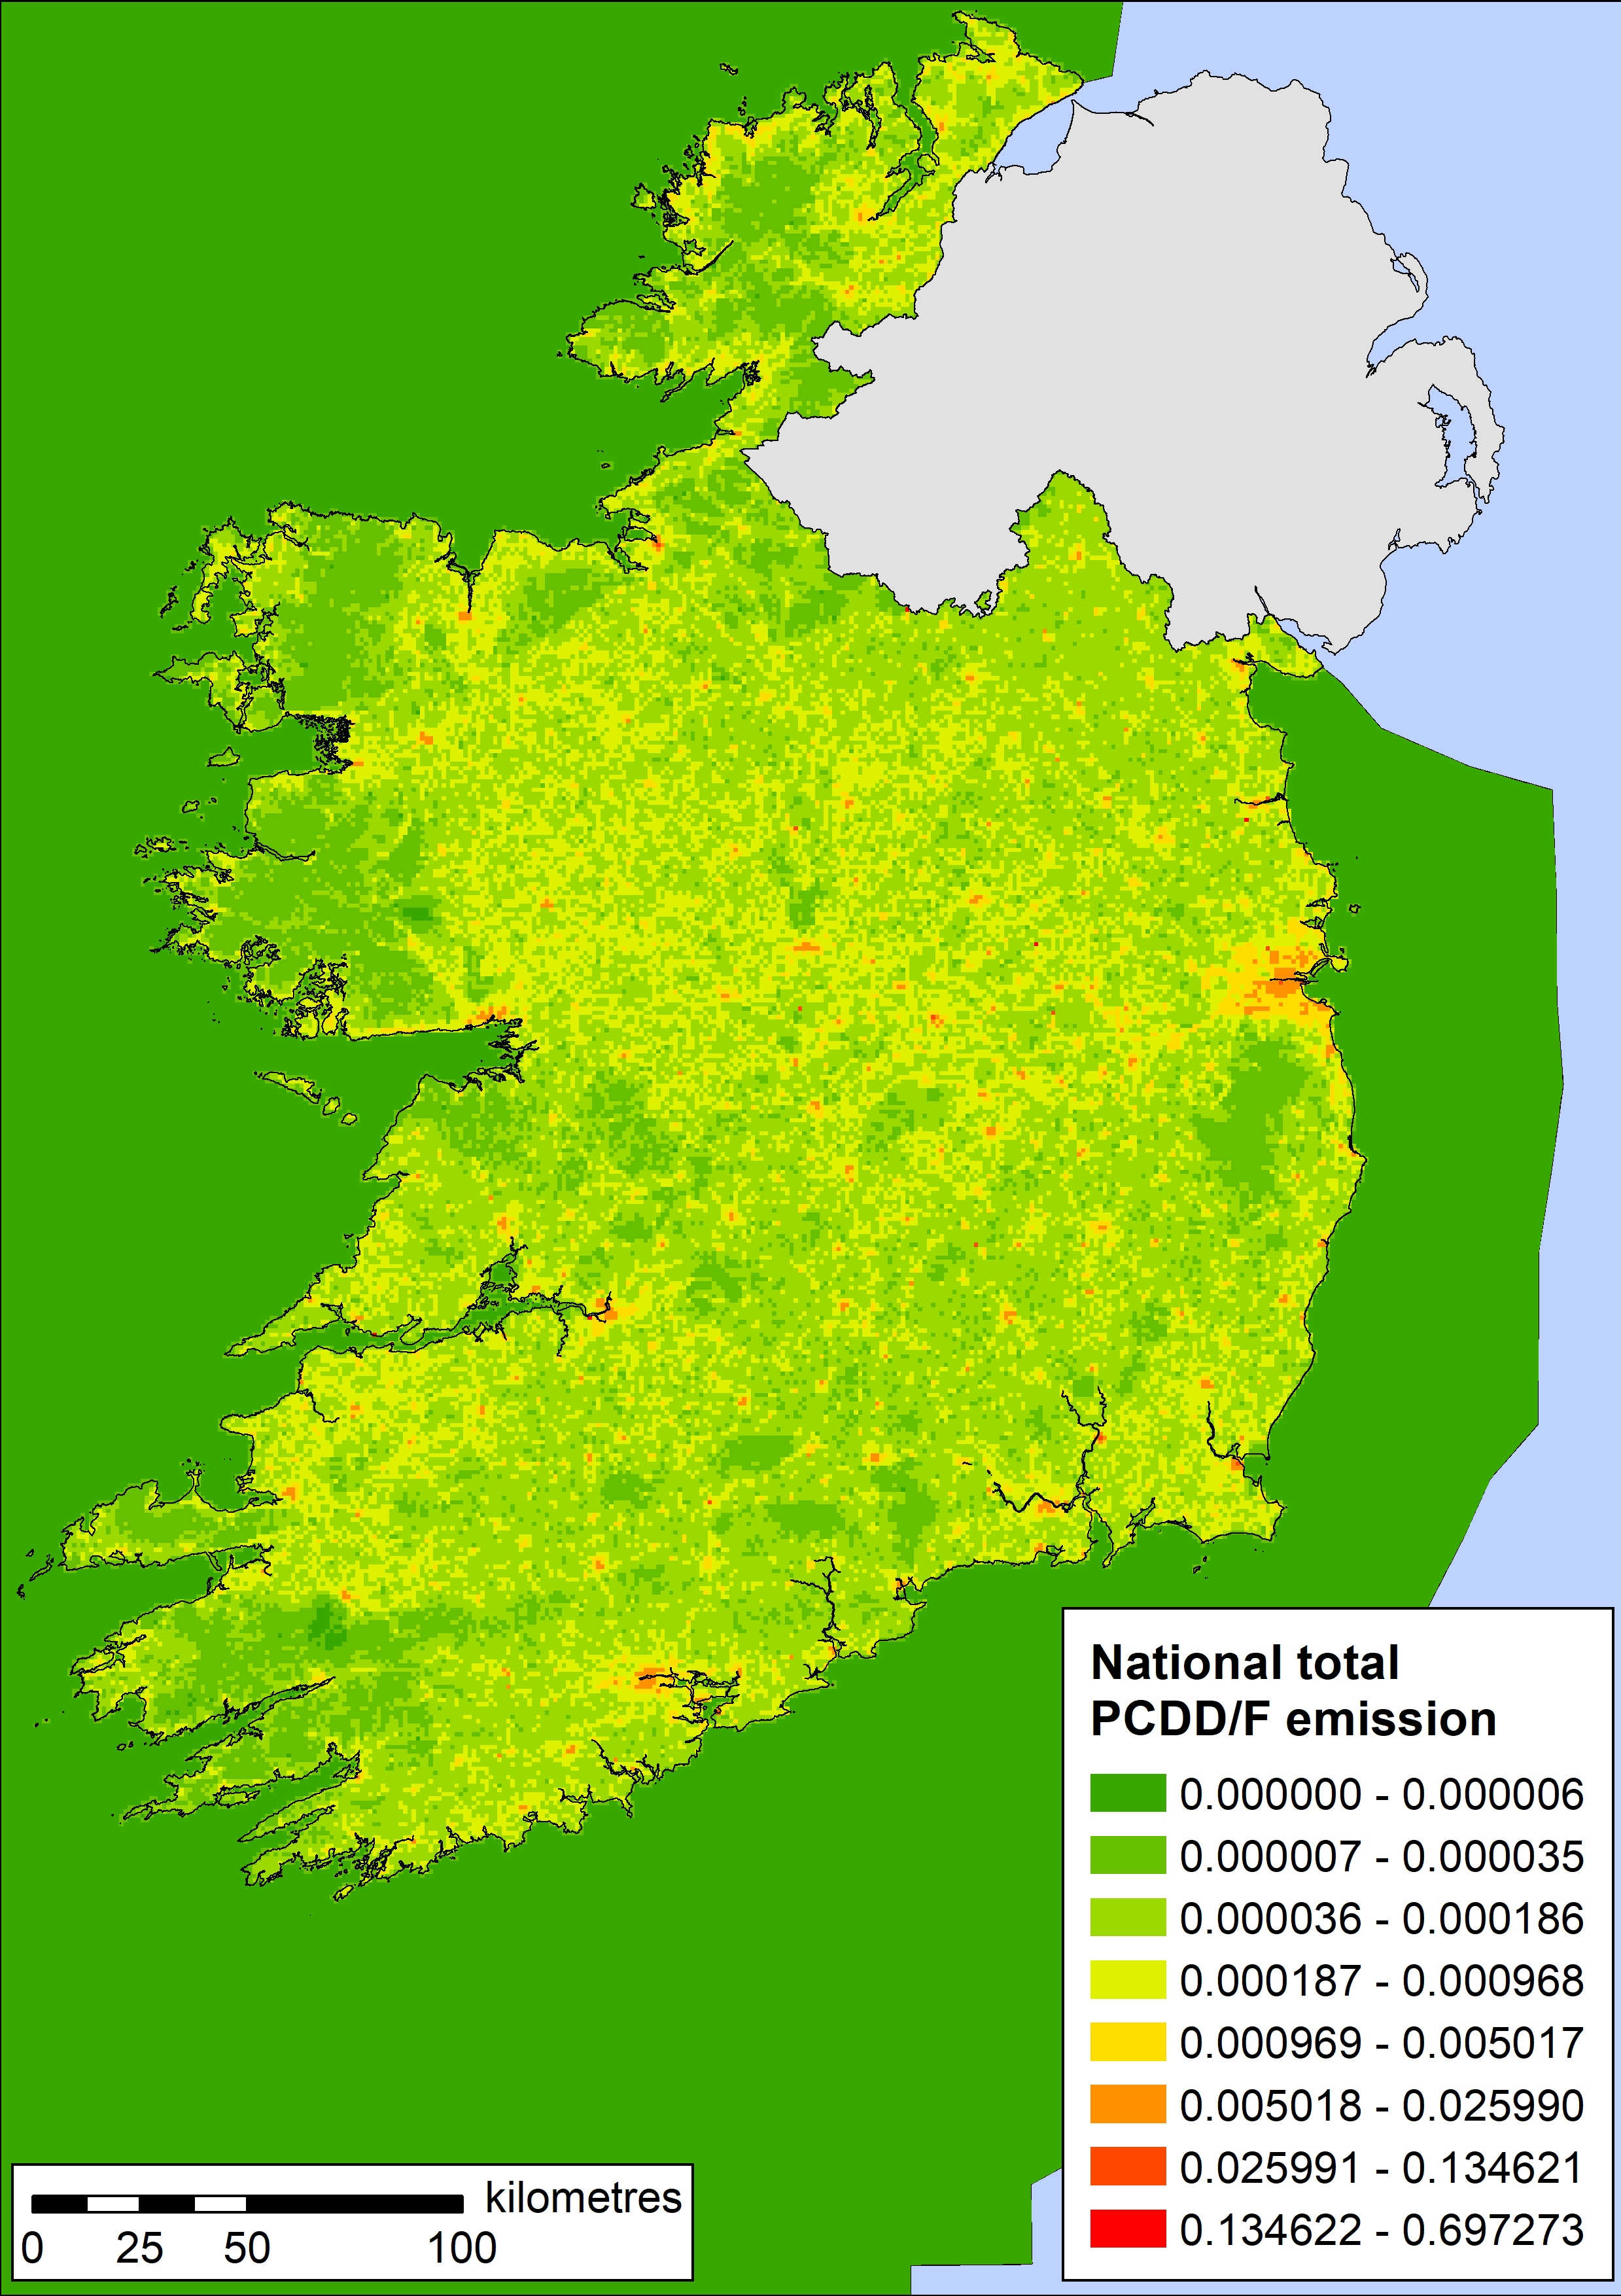
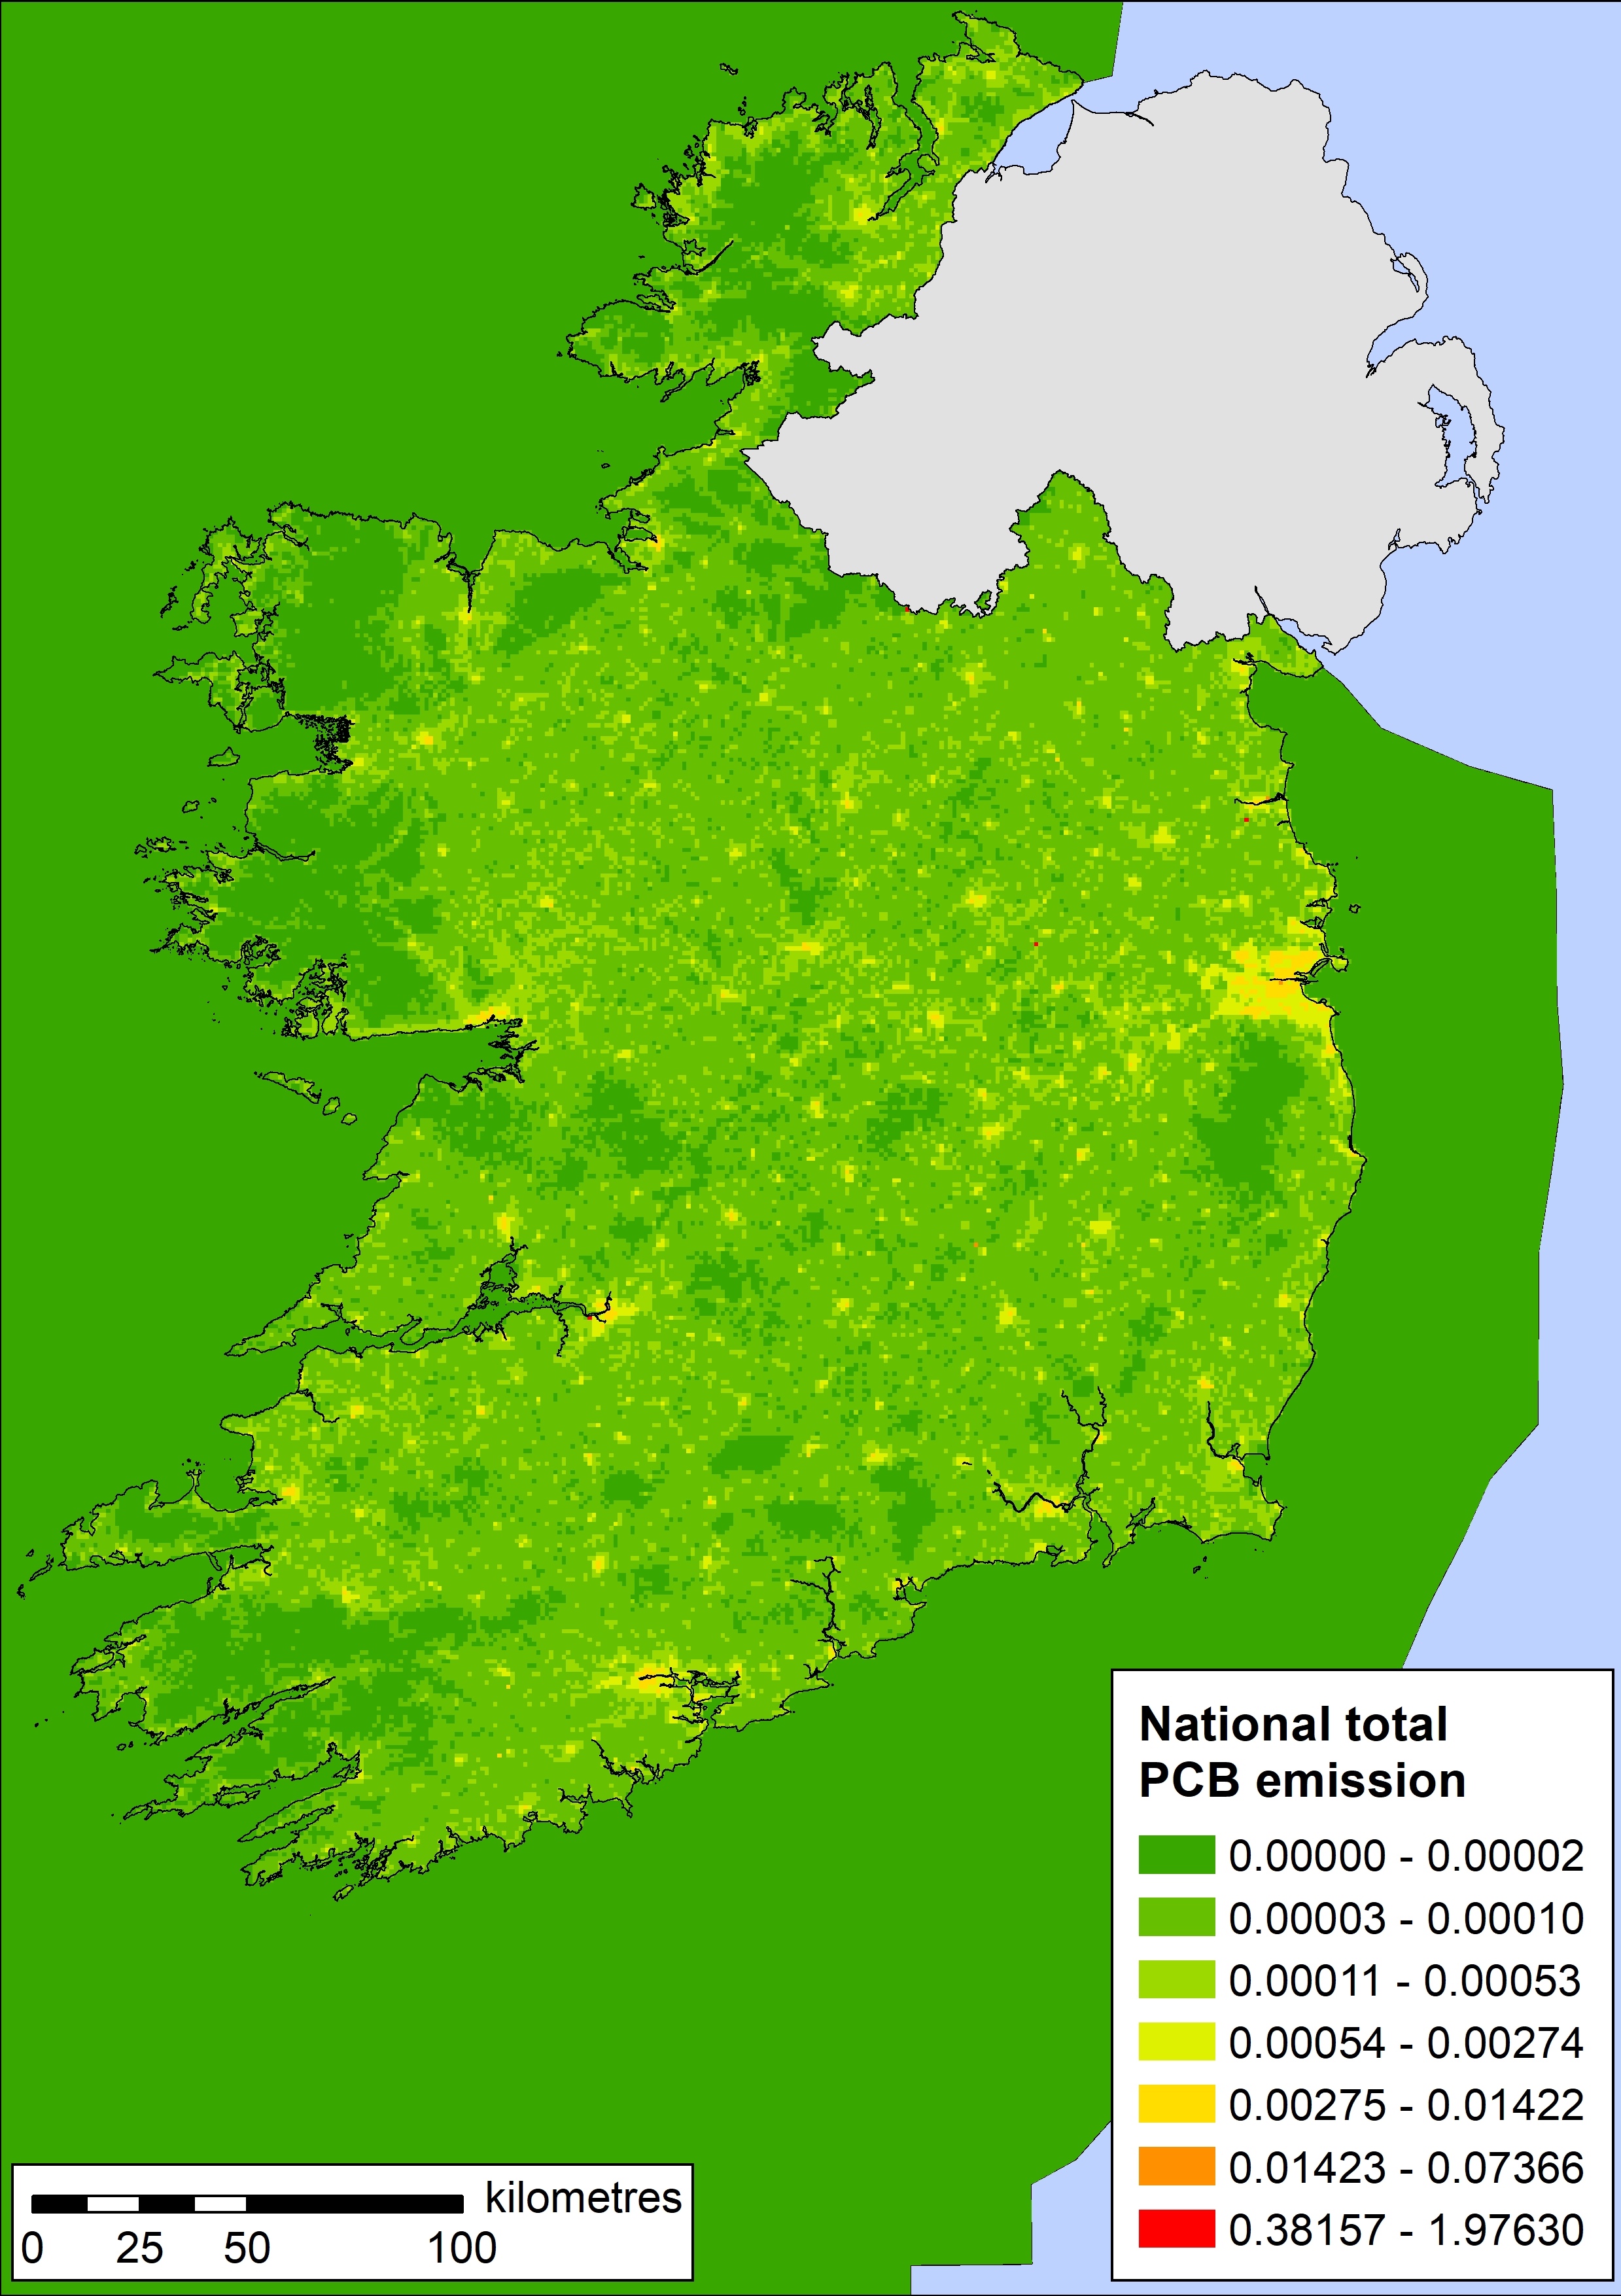
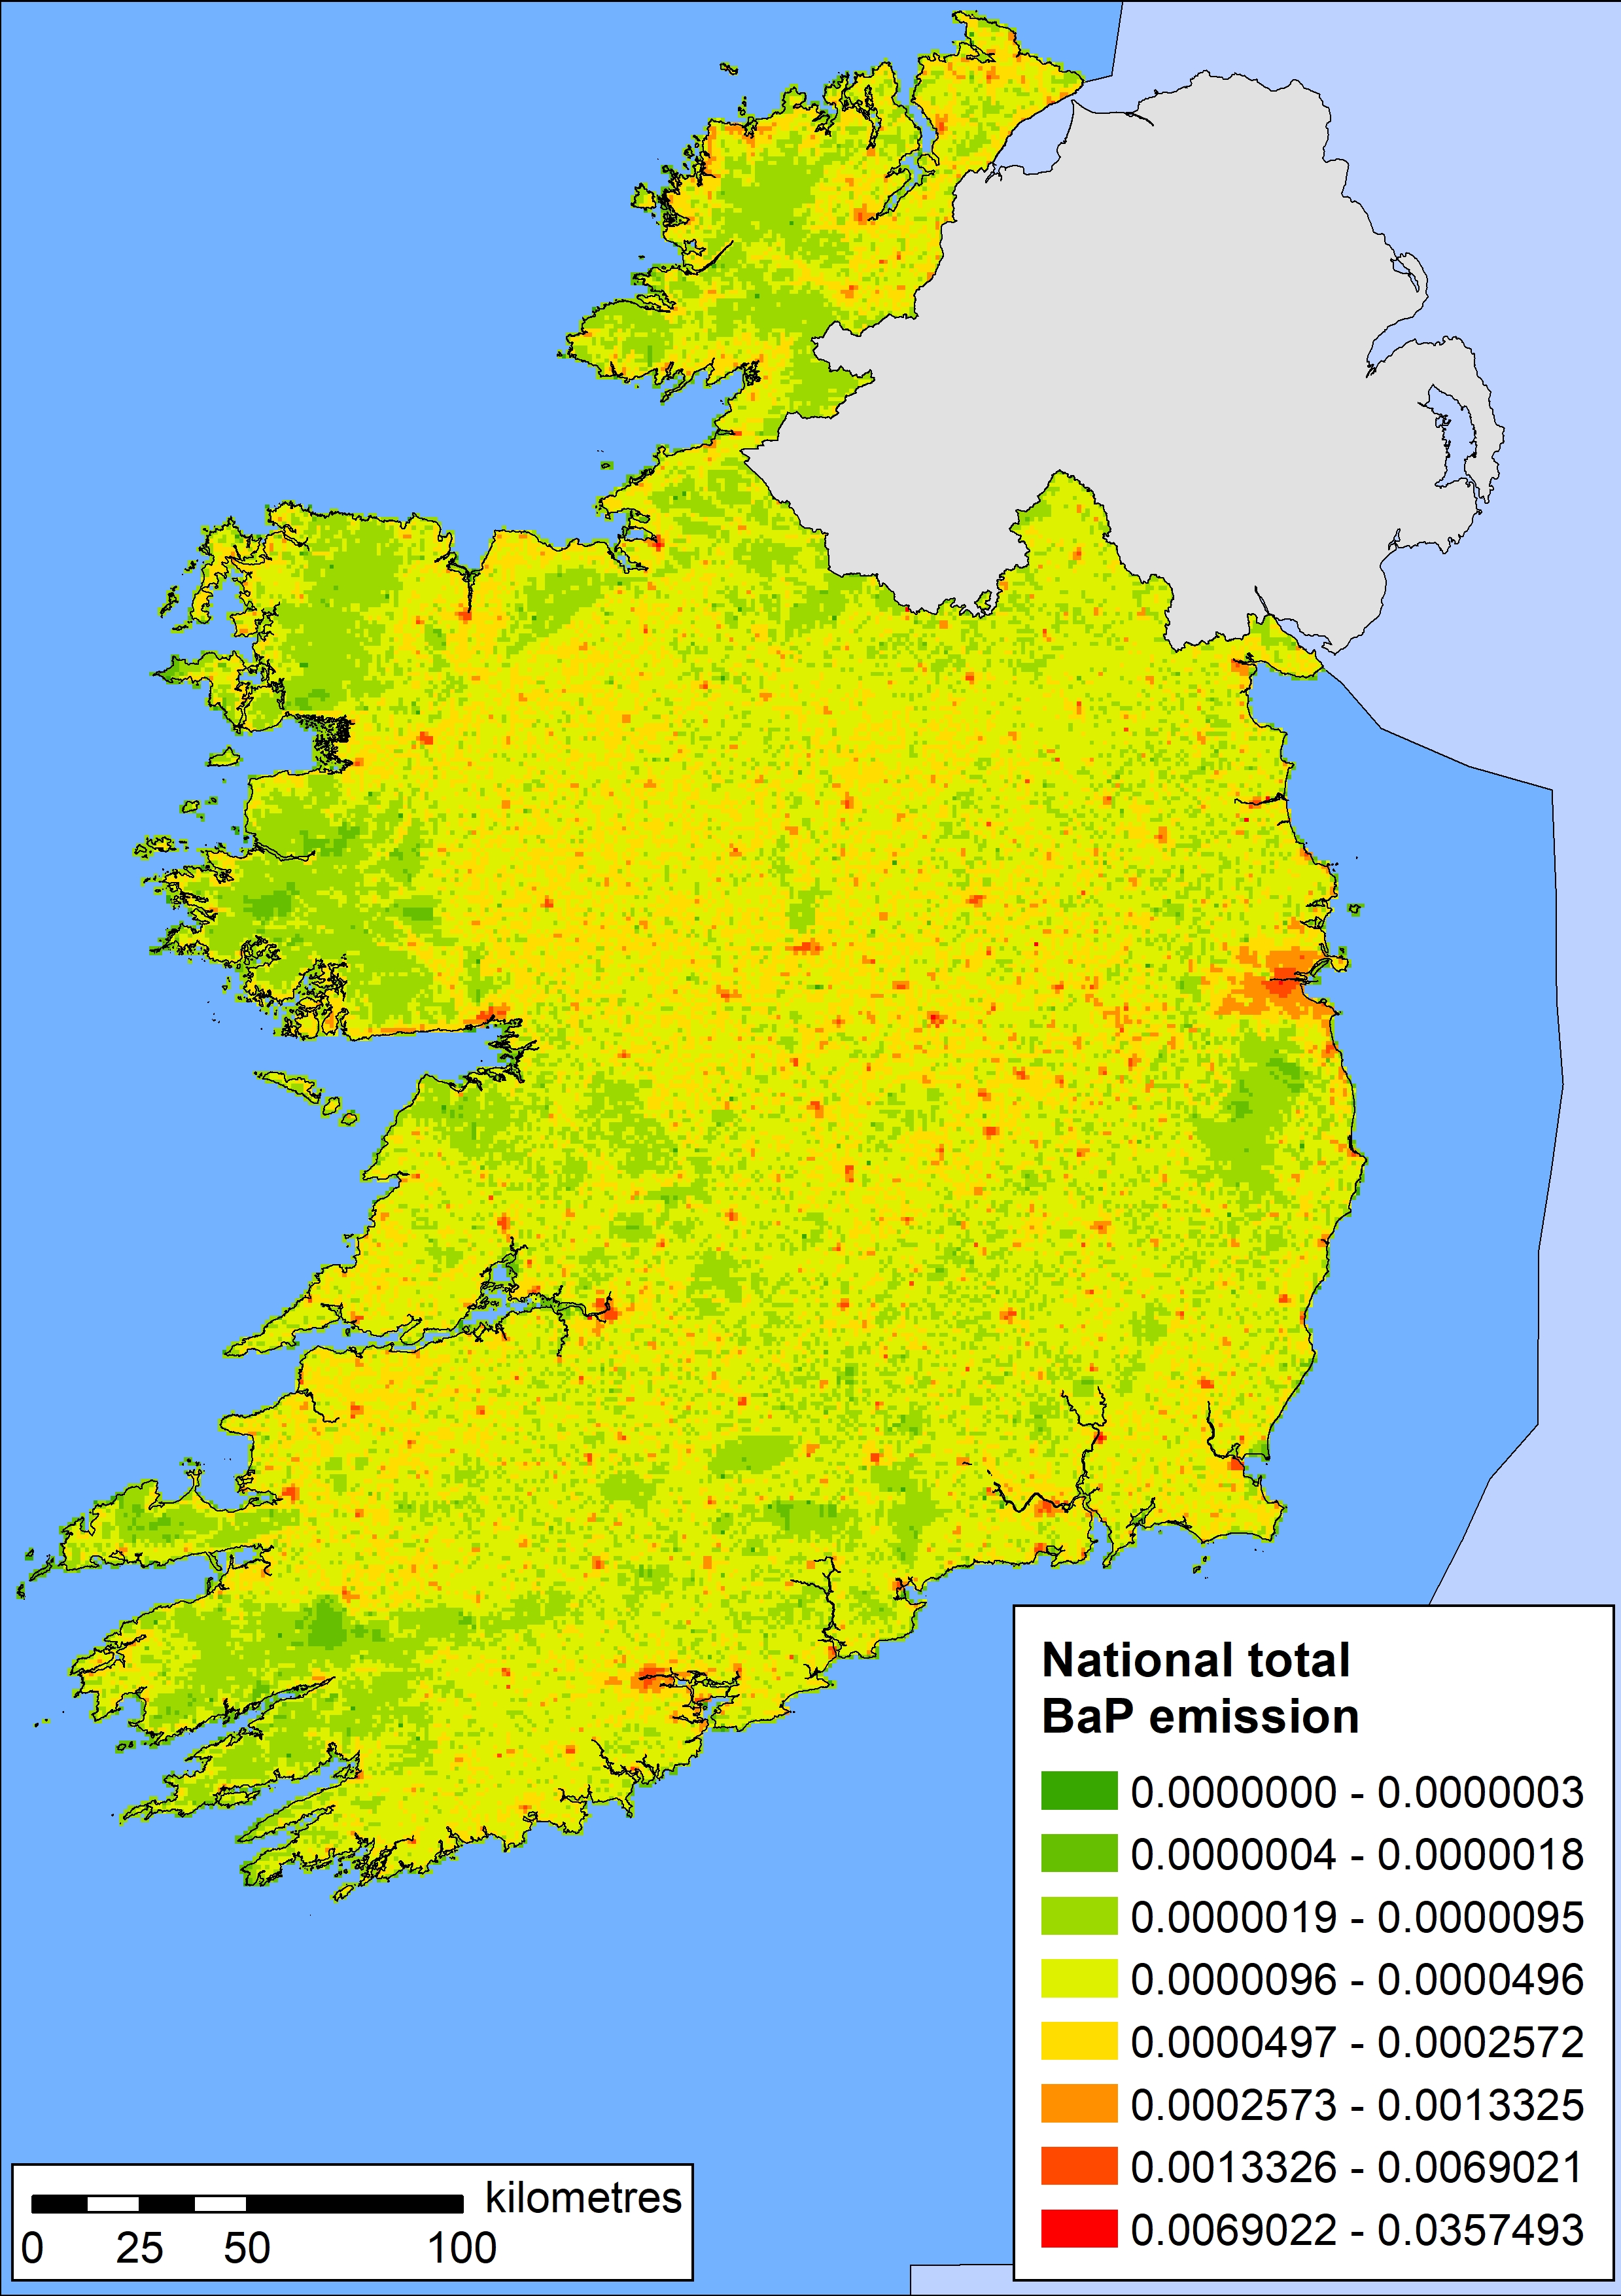
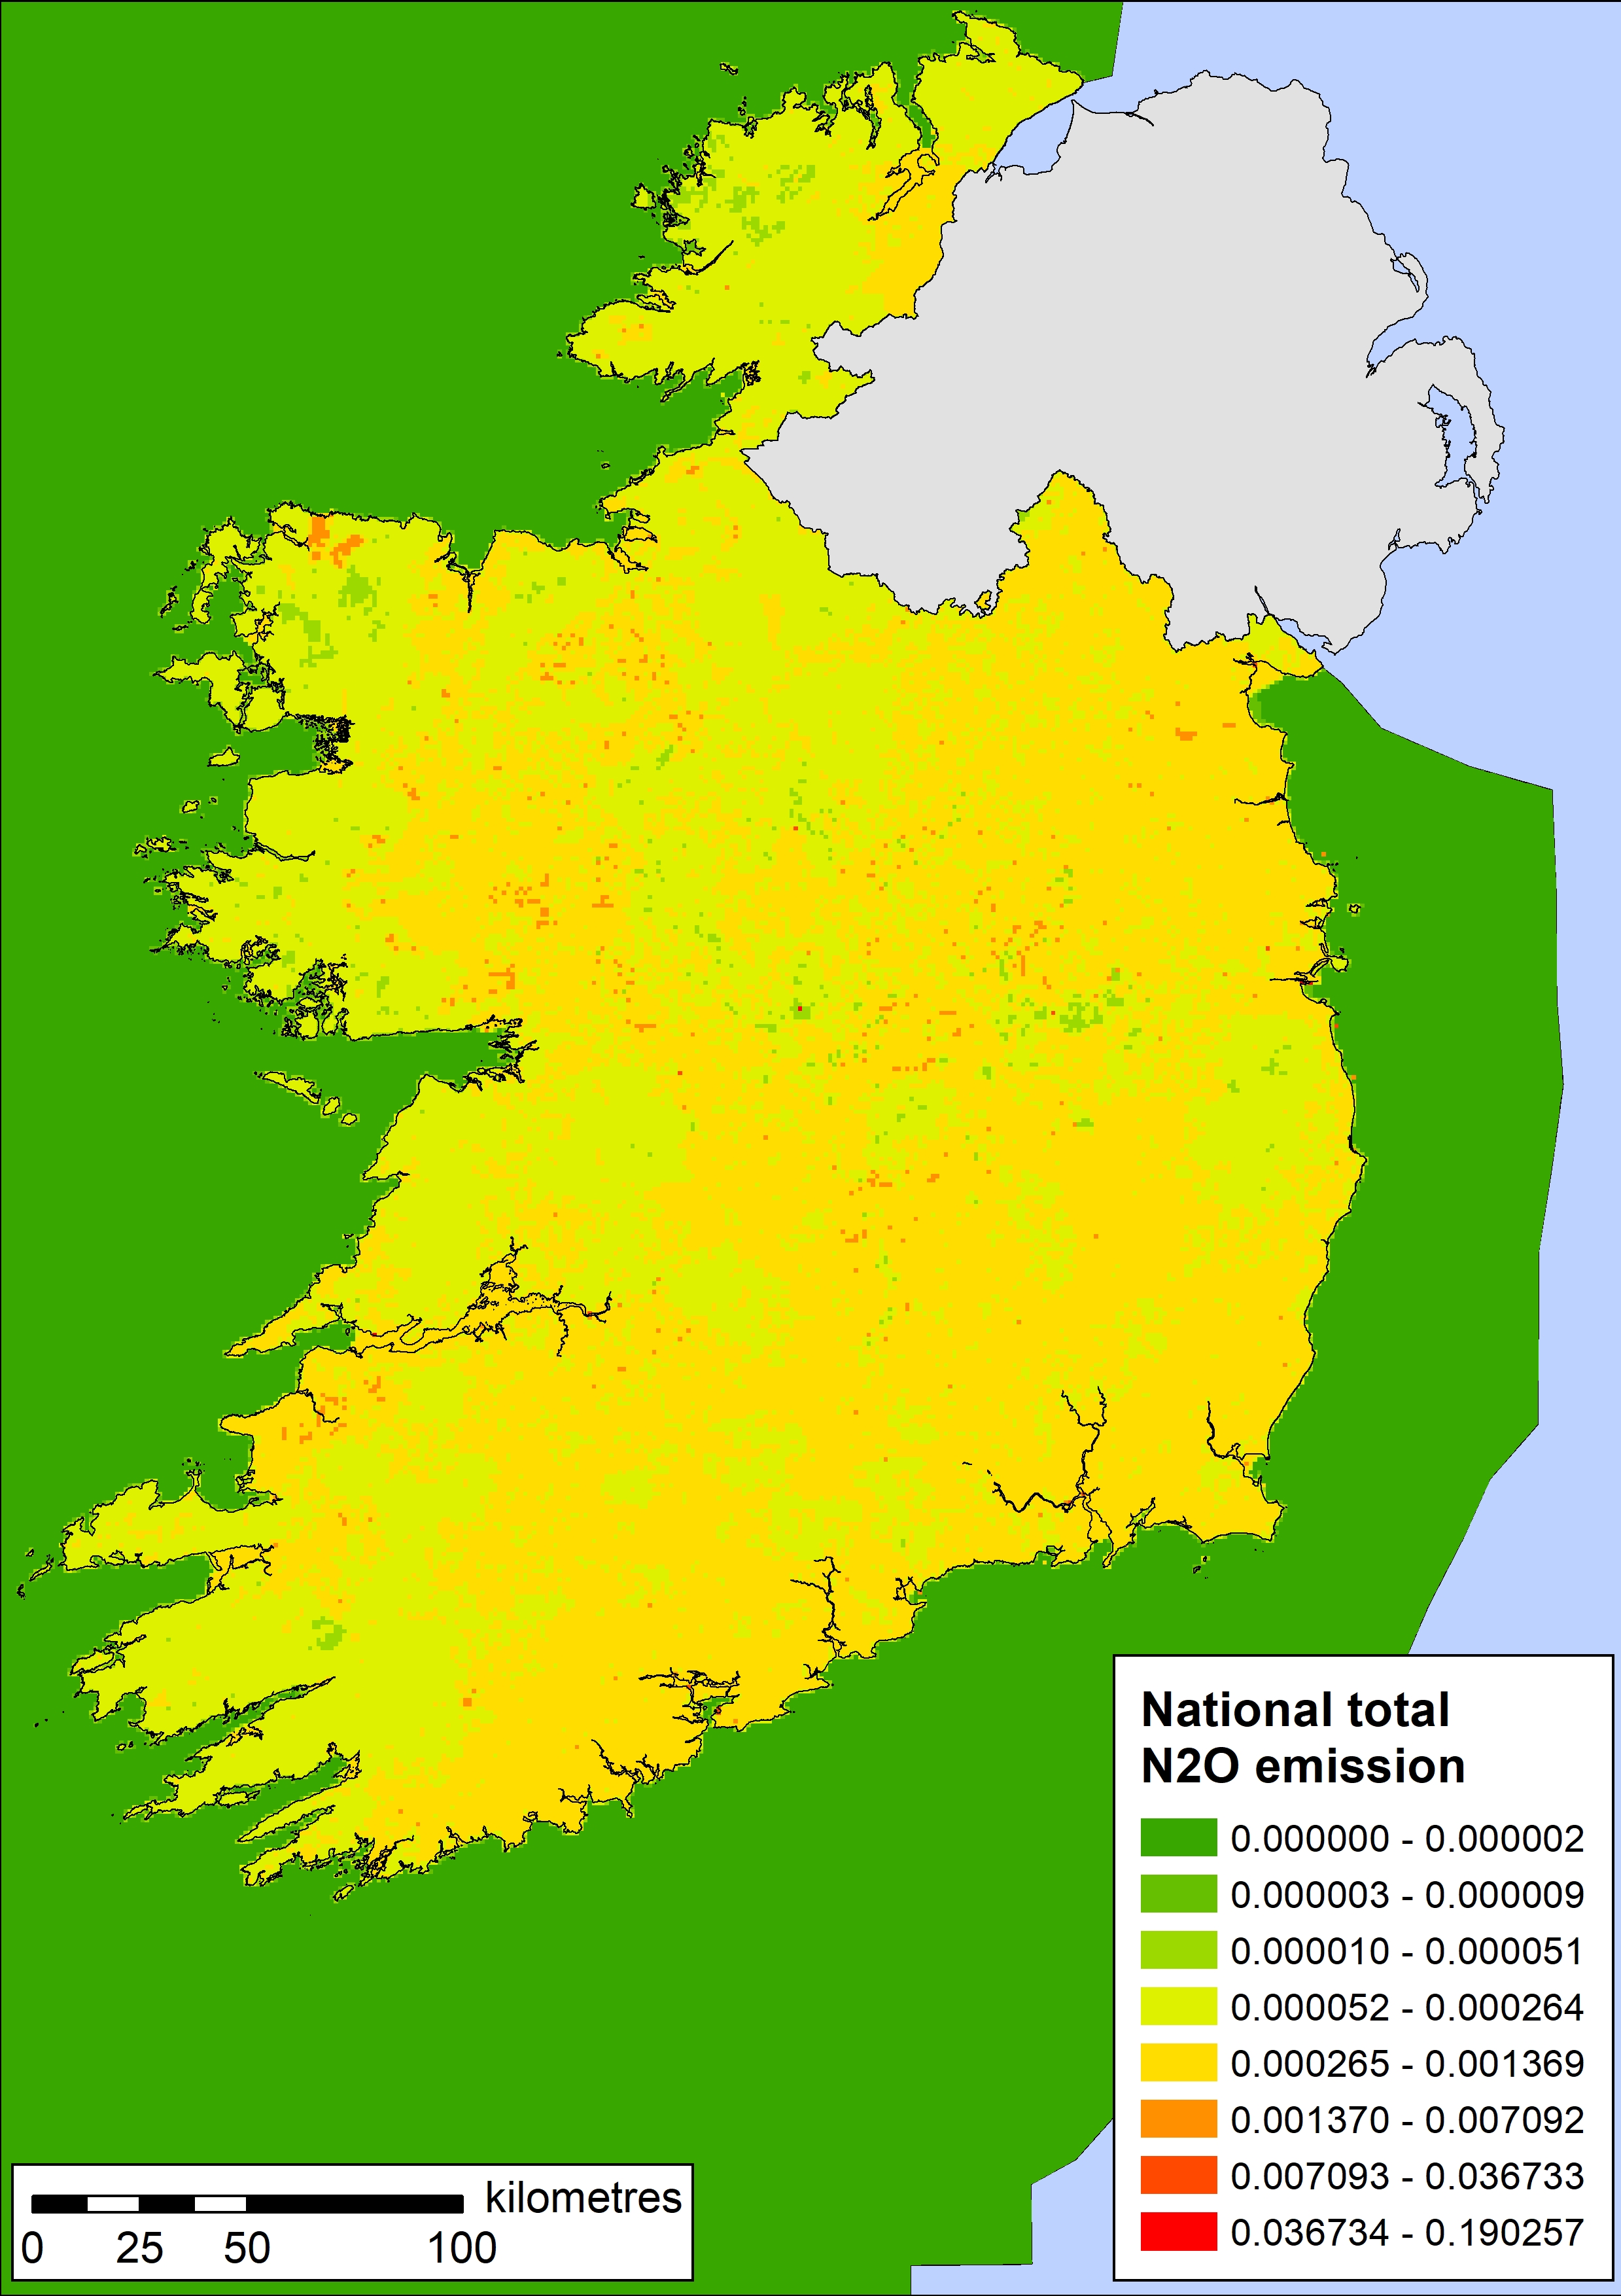
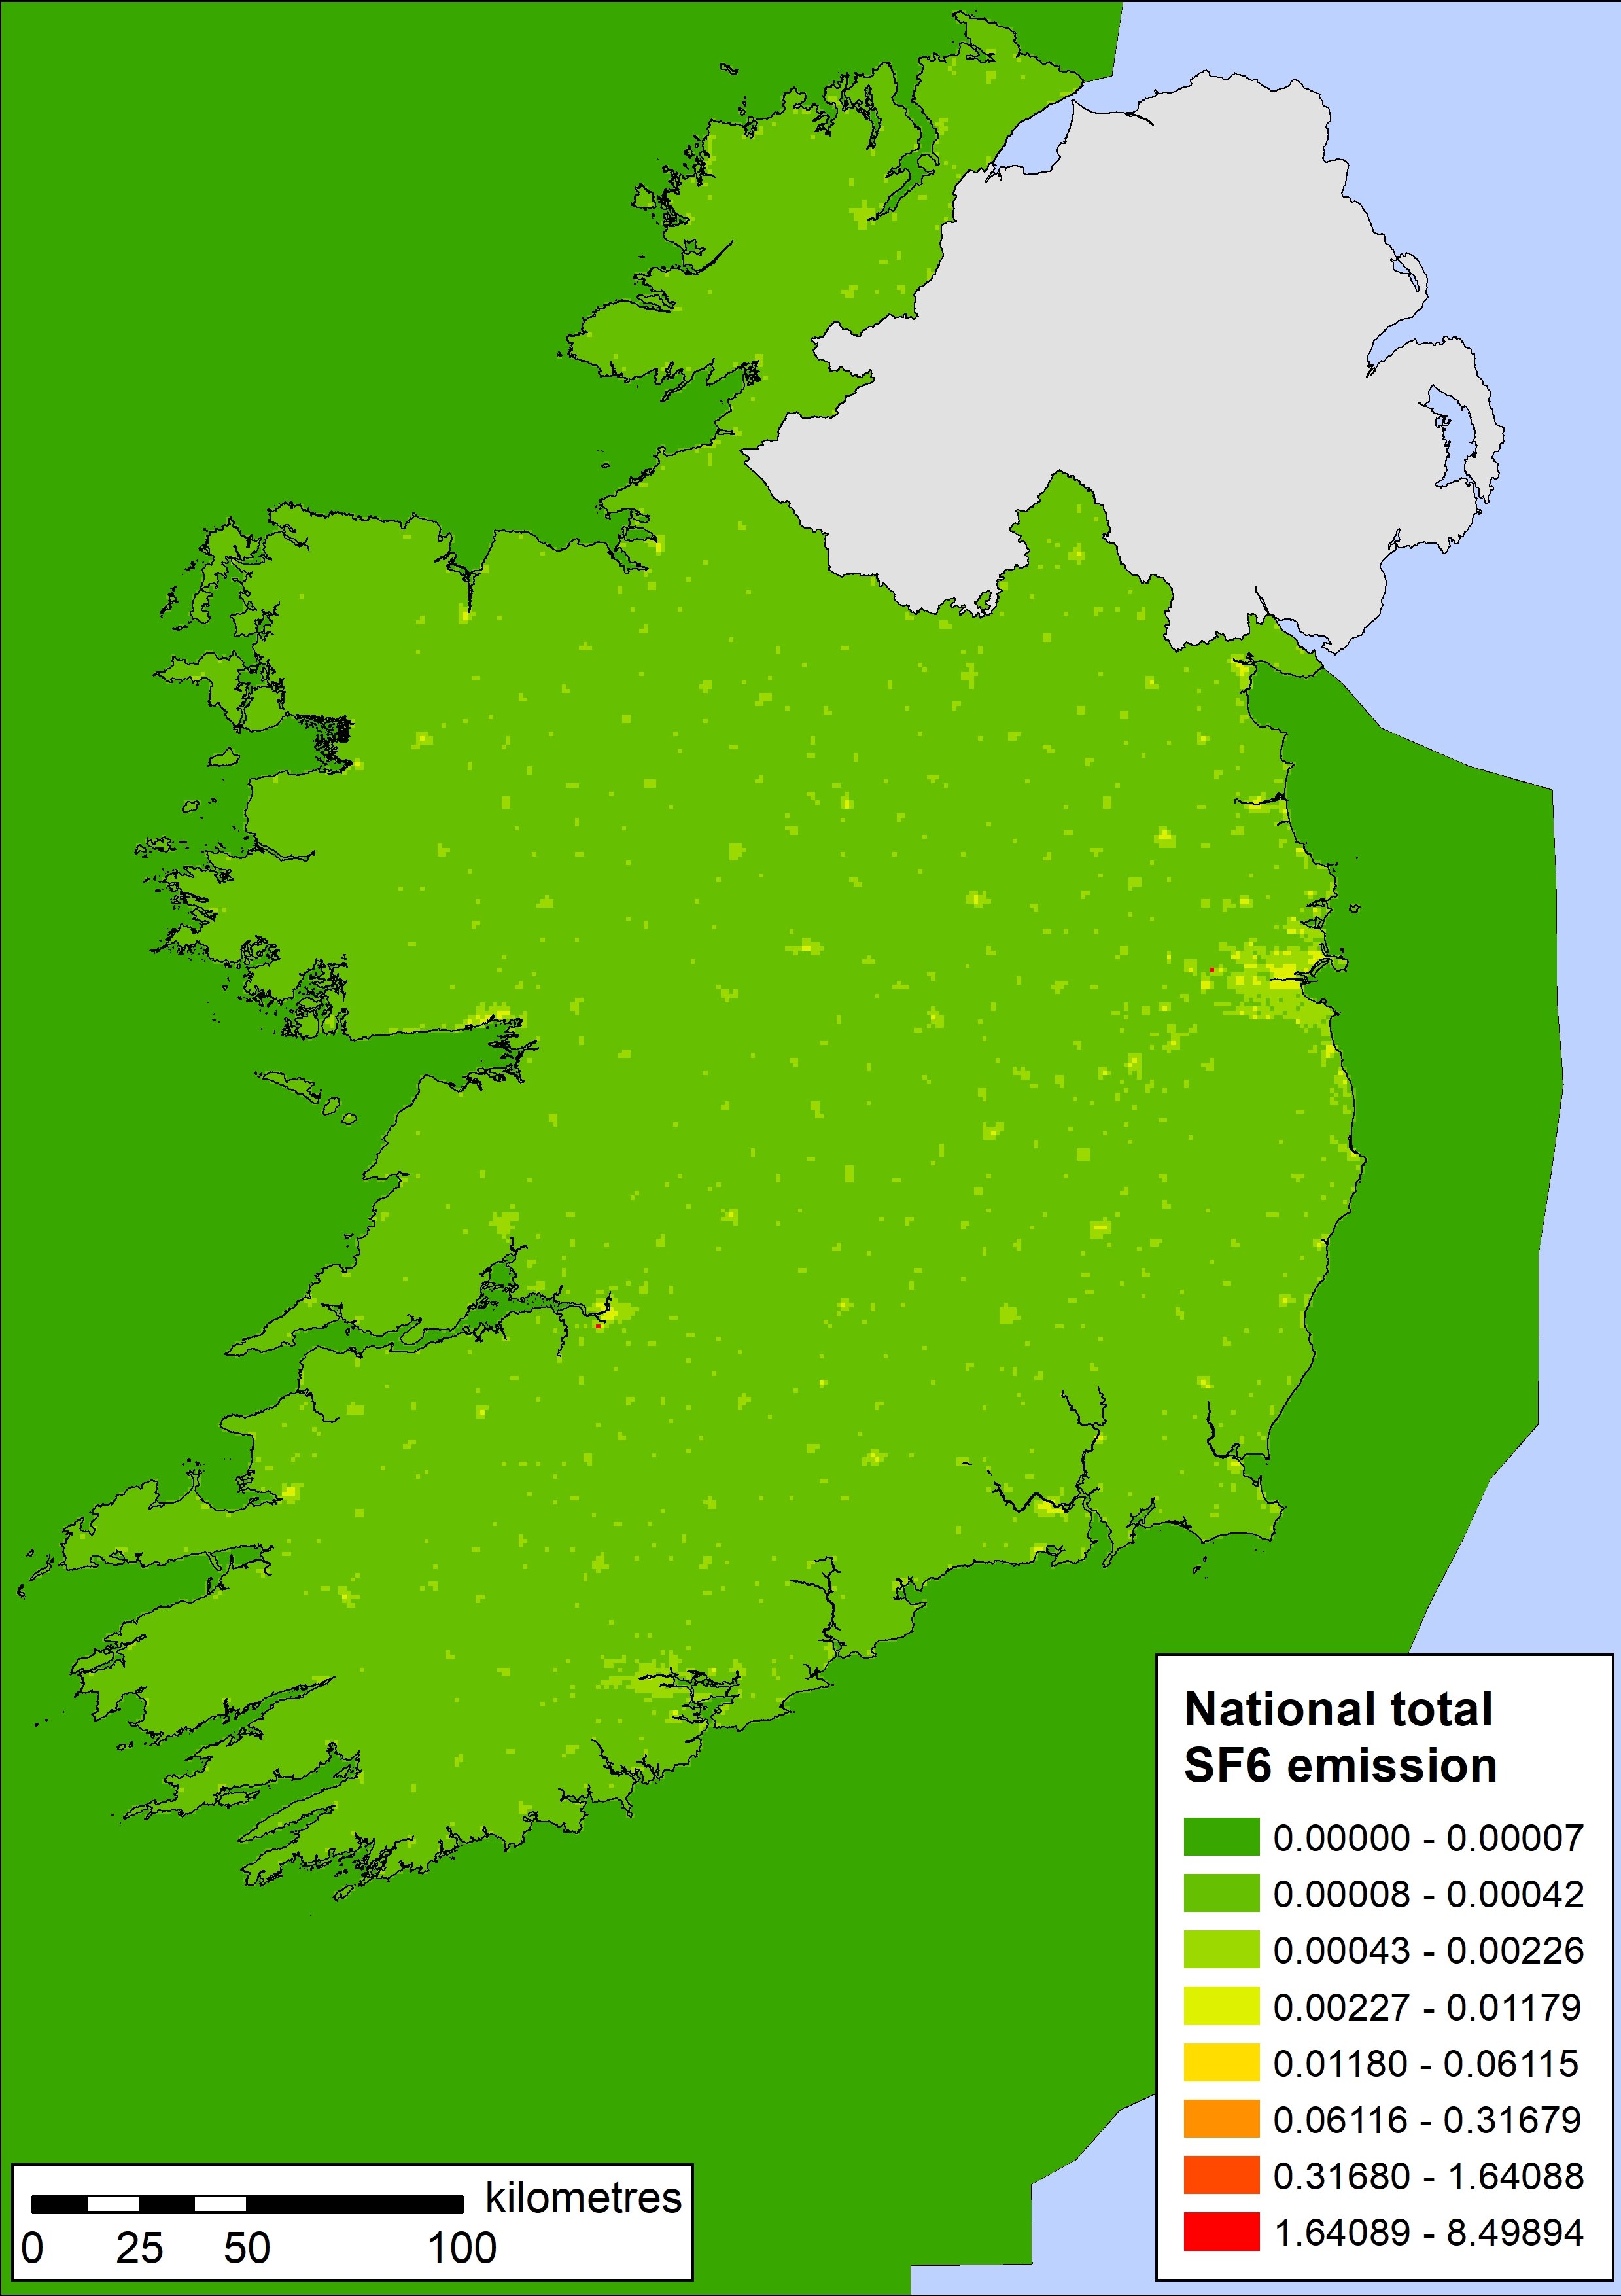
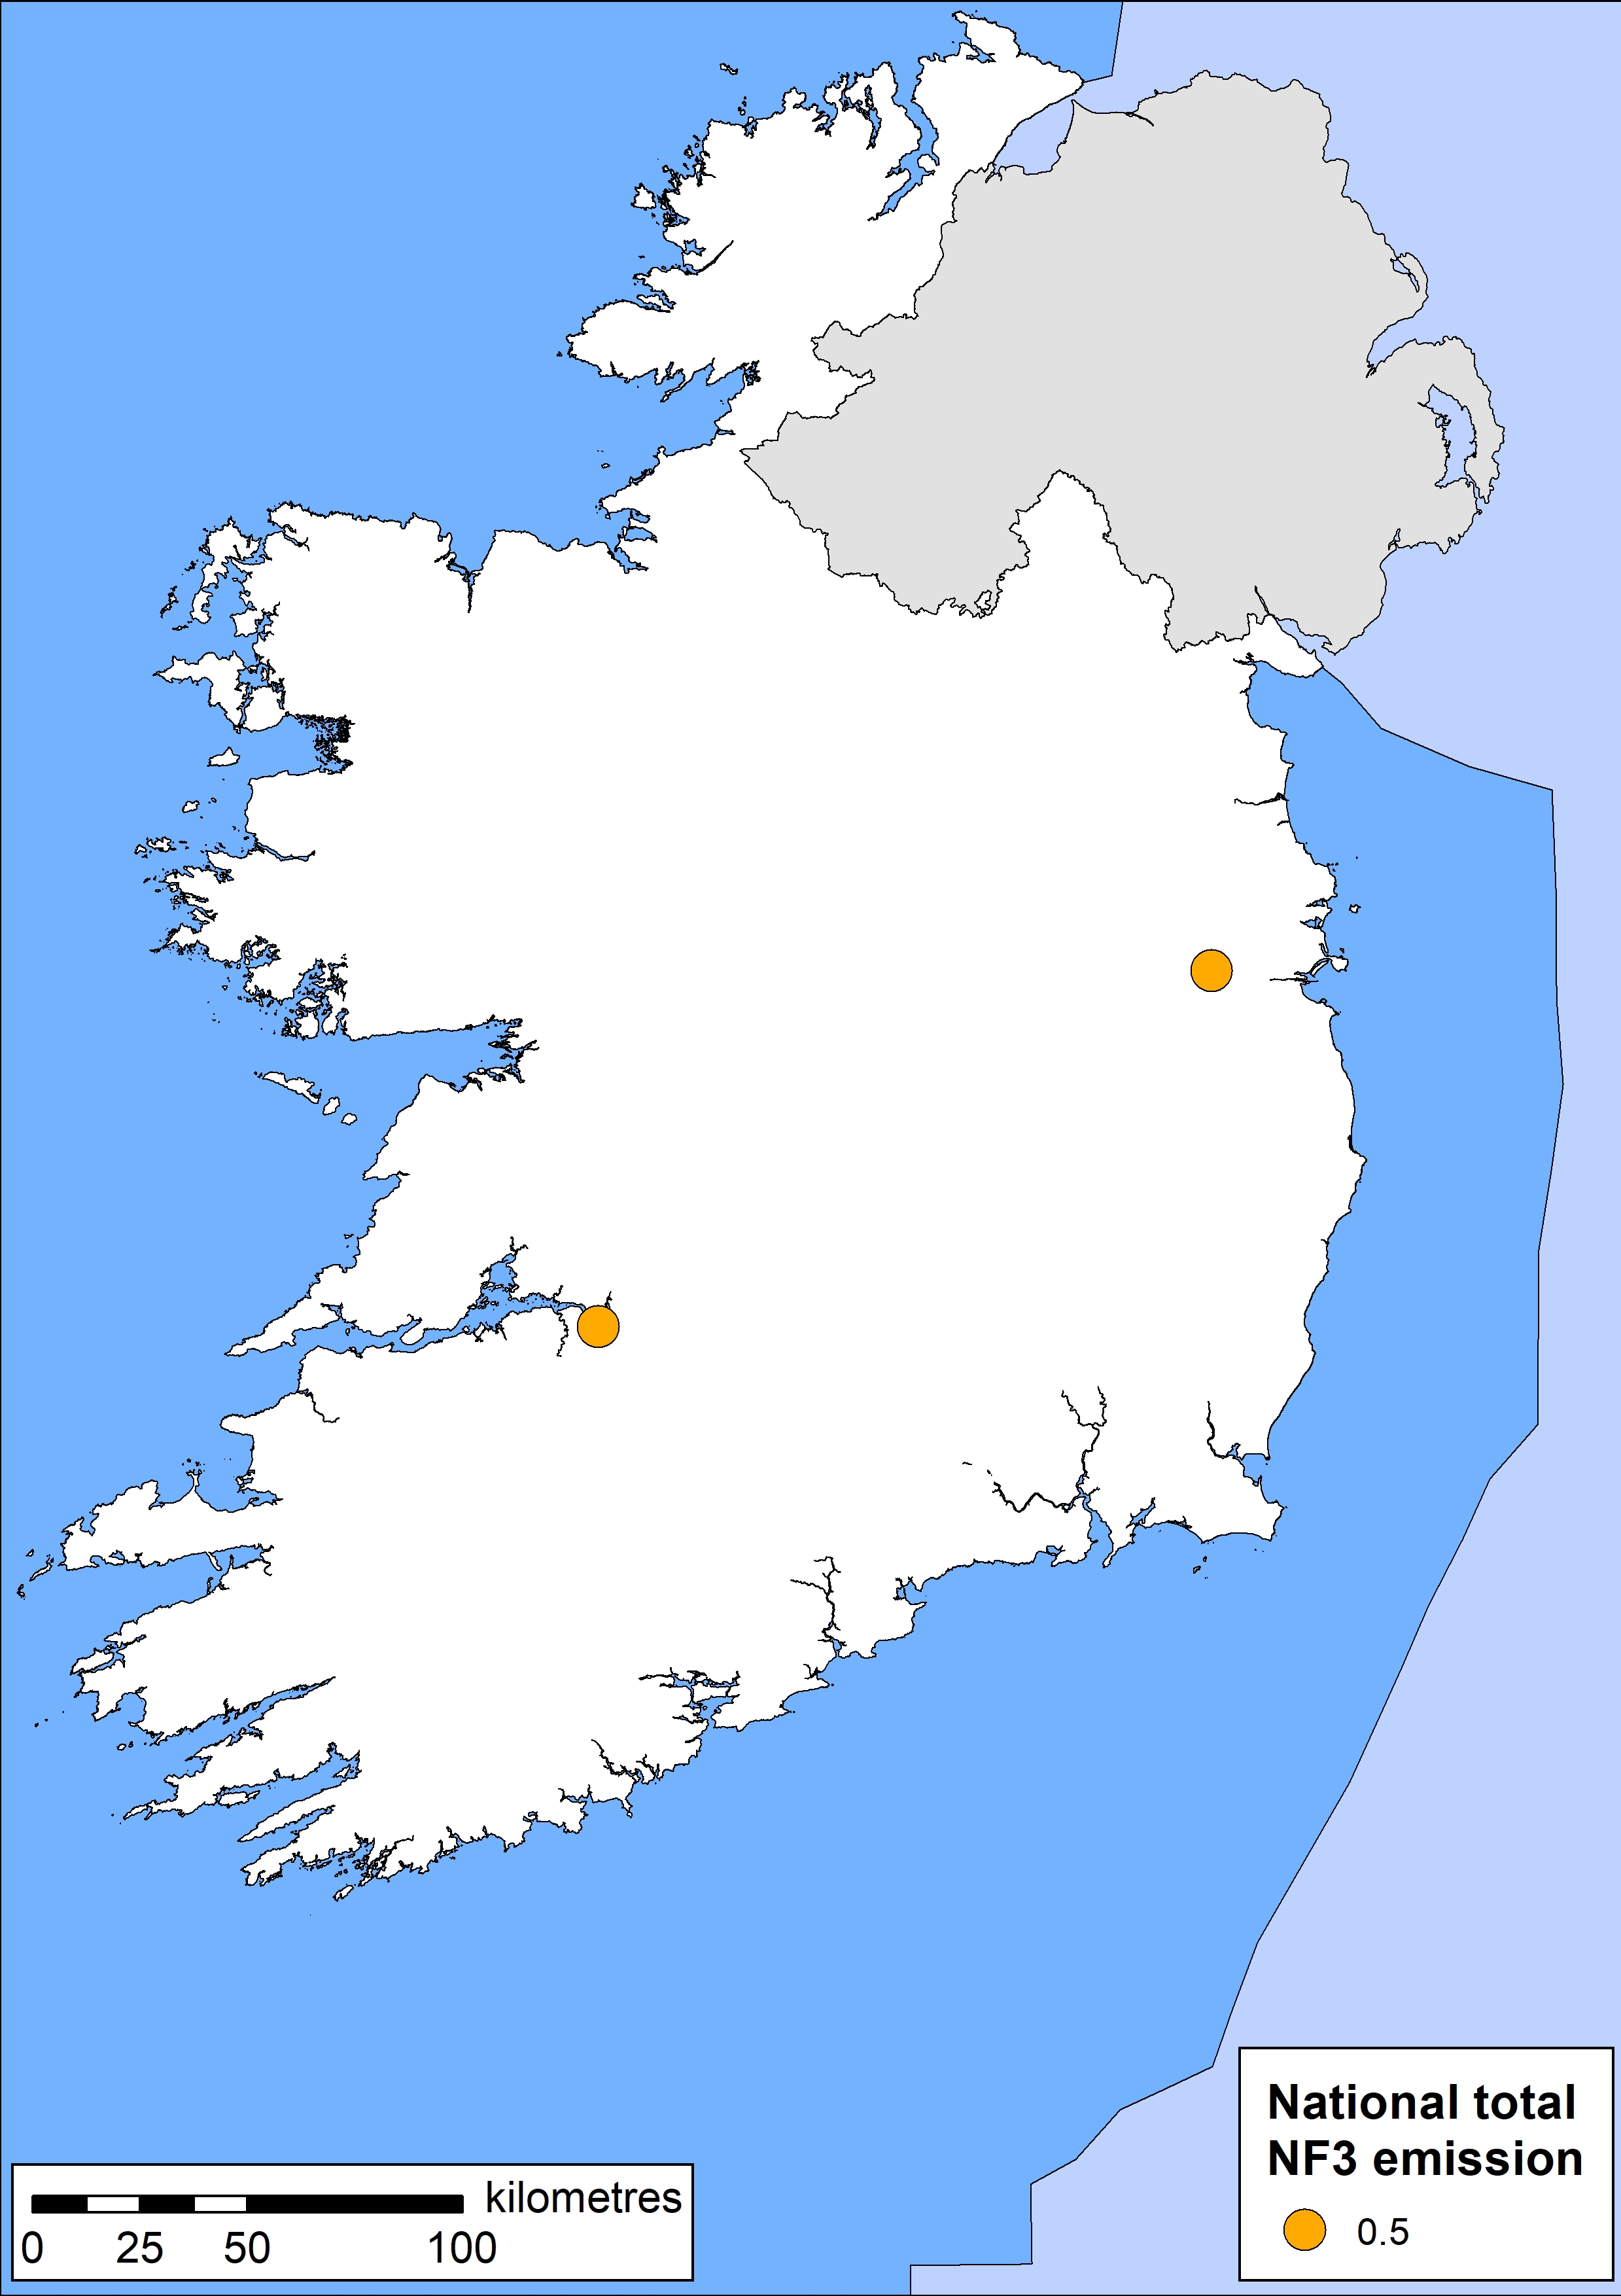
Results from the spatial model can be downloaded via the links below. The shapefiles include emissions from the national emission inventories for air pollution (AP) and greenhouse gases (GHG) spatially distributed on a grid with a geographical resolution of 1 km x 1 km using the Irish projection TM65.
Spatial emissions are available for download as shapefiles both as national totals in the files [year]_NFR_total and [year]_CRF_total. Further, spatial emissions are available on sectoral level corresponding the GNFR sectors used for reporting of gridded emissions to the UNECE LRTAP convention. The LULUCF sector are not included in the GNFR sectors as this sector is only relevant for the GHG inventory. Consequently, a separate sector has been added in the spatial model for the LULUCF sector (q_LULUCF).
National total emissions in 2016 of
NOx, NMVOC, SO2, NH3, PM2.5, PM10, TSP, BC, CO,
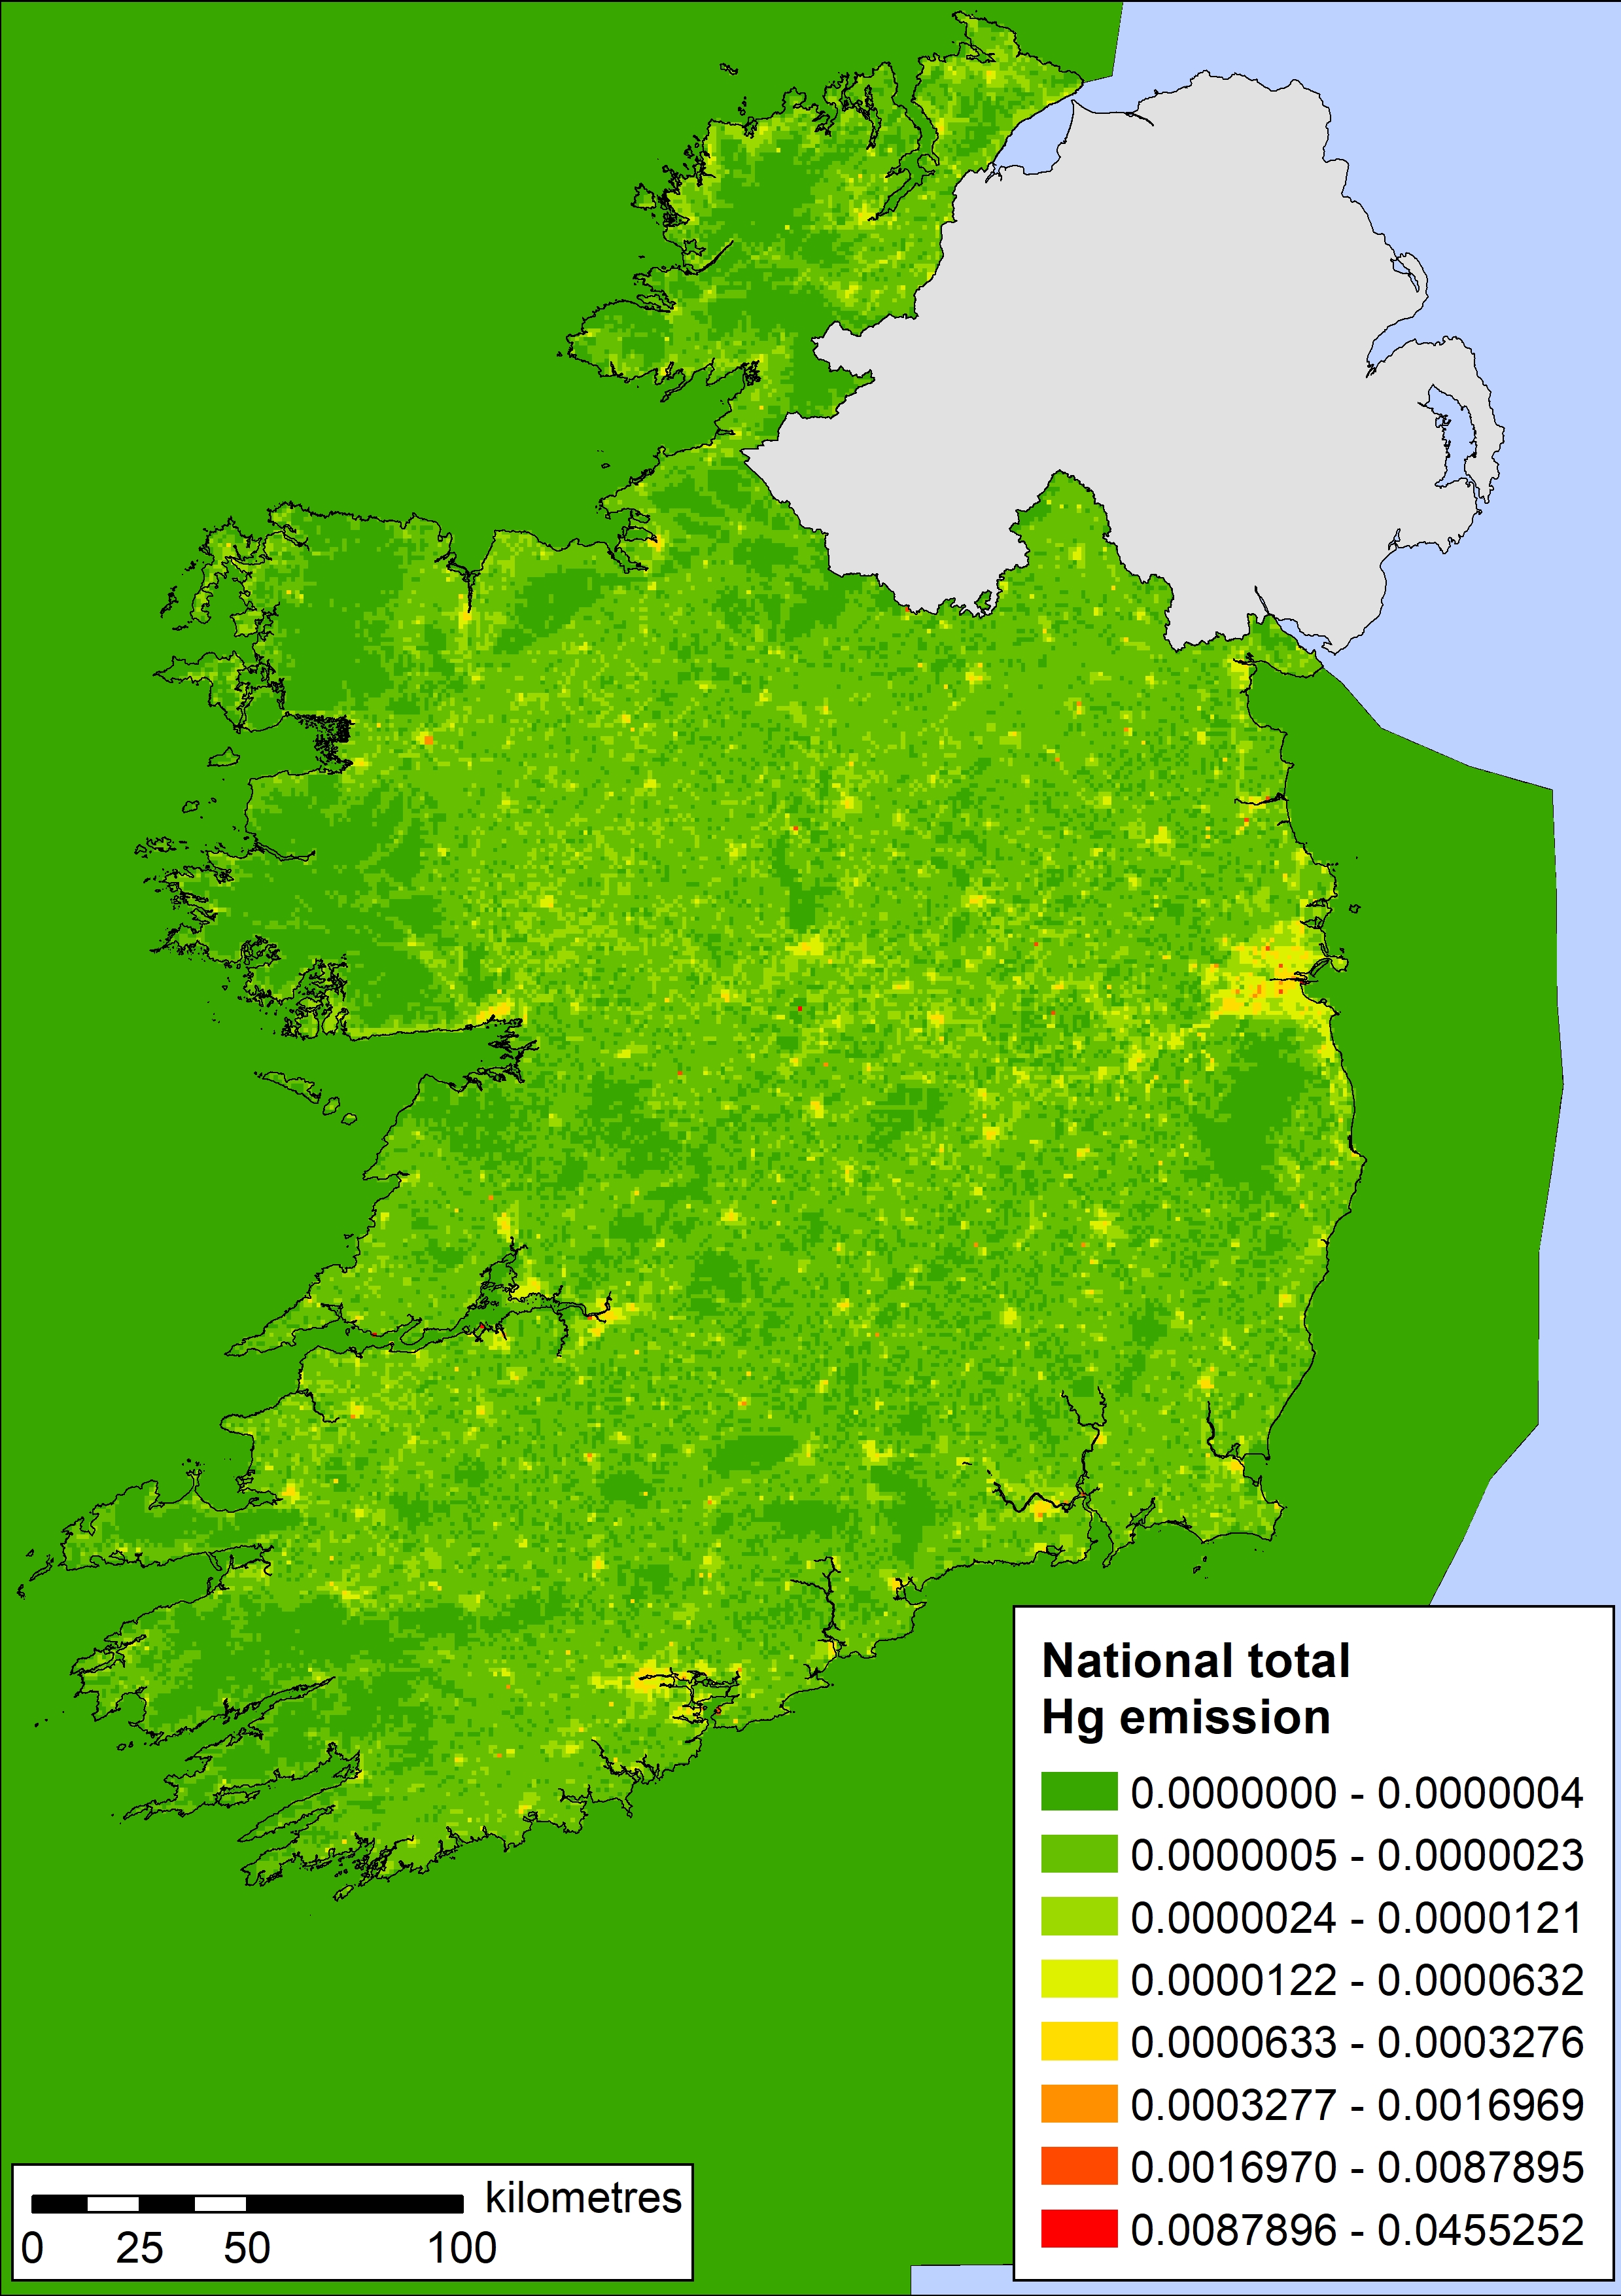
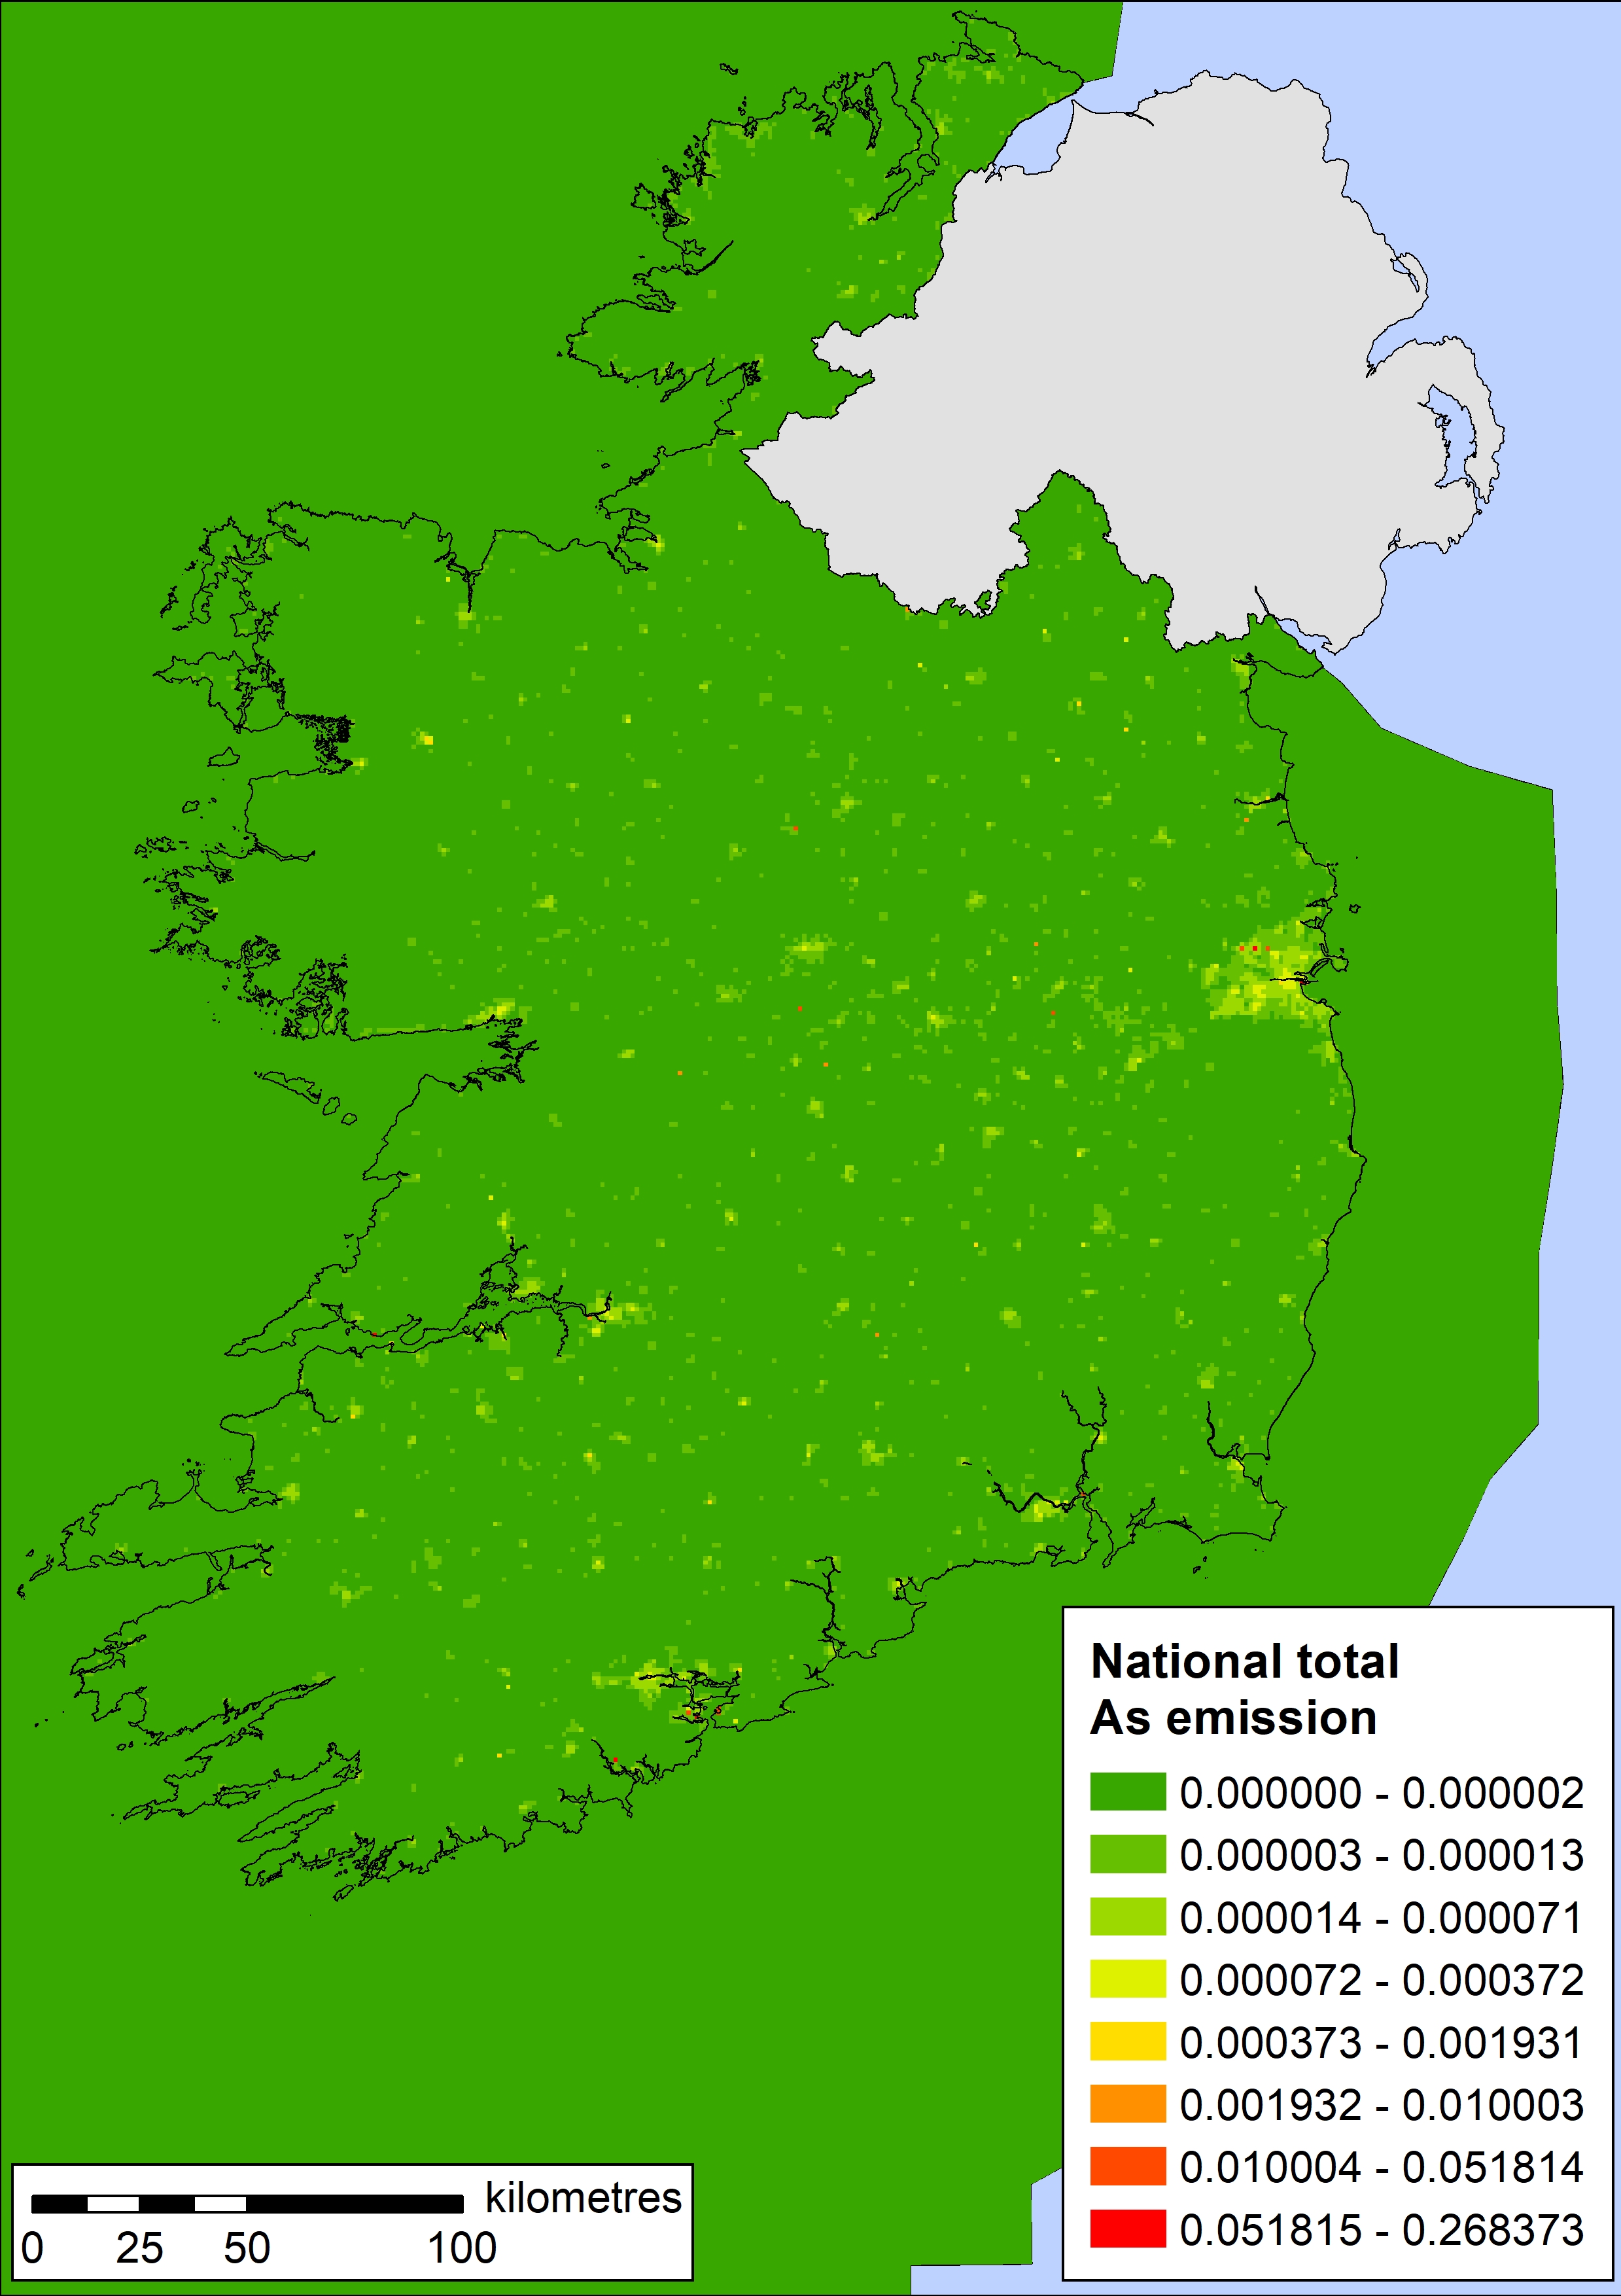
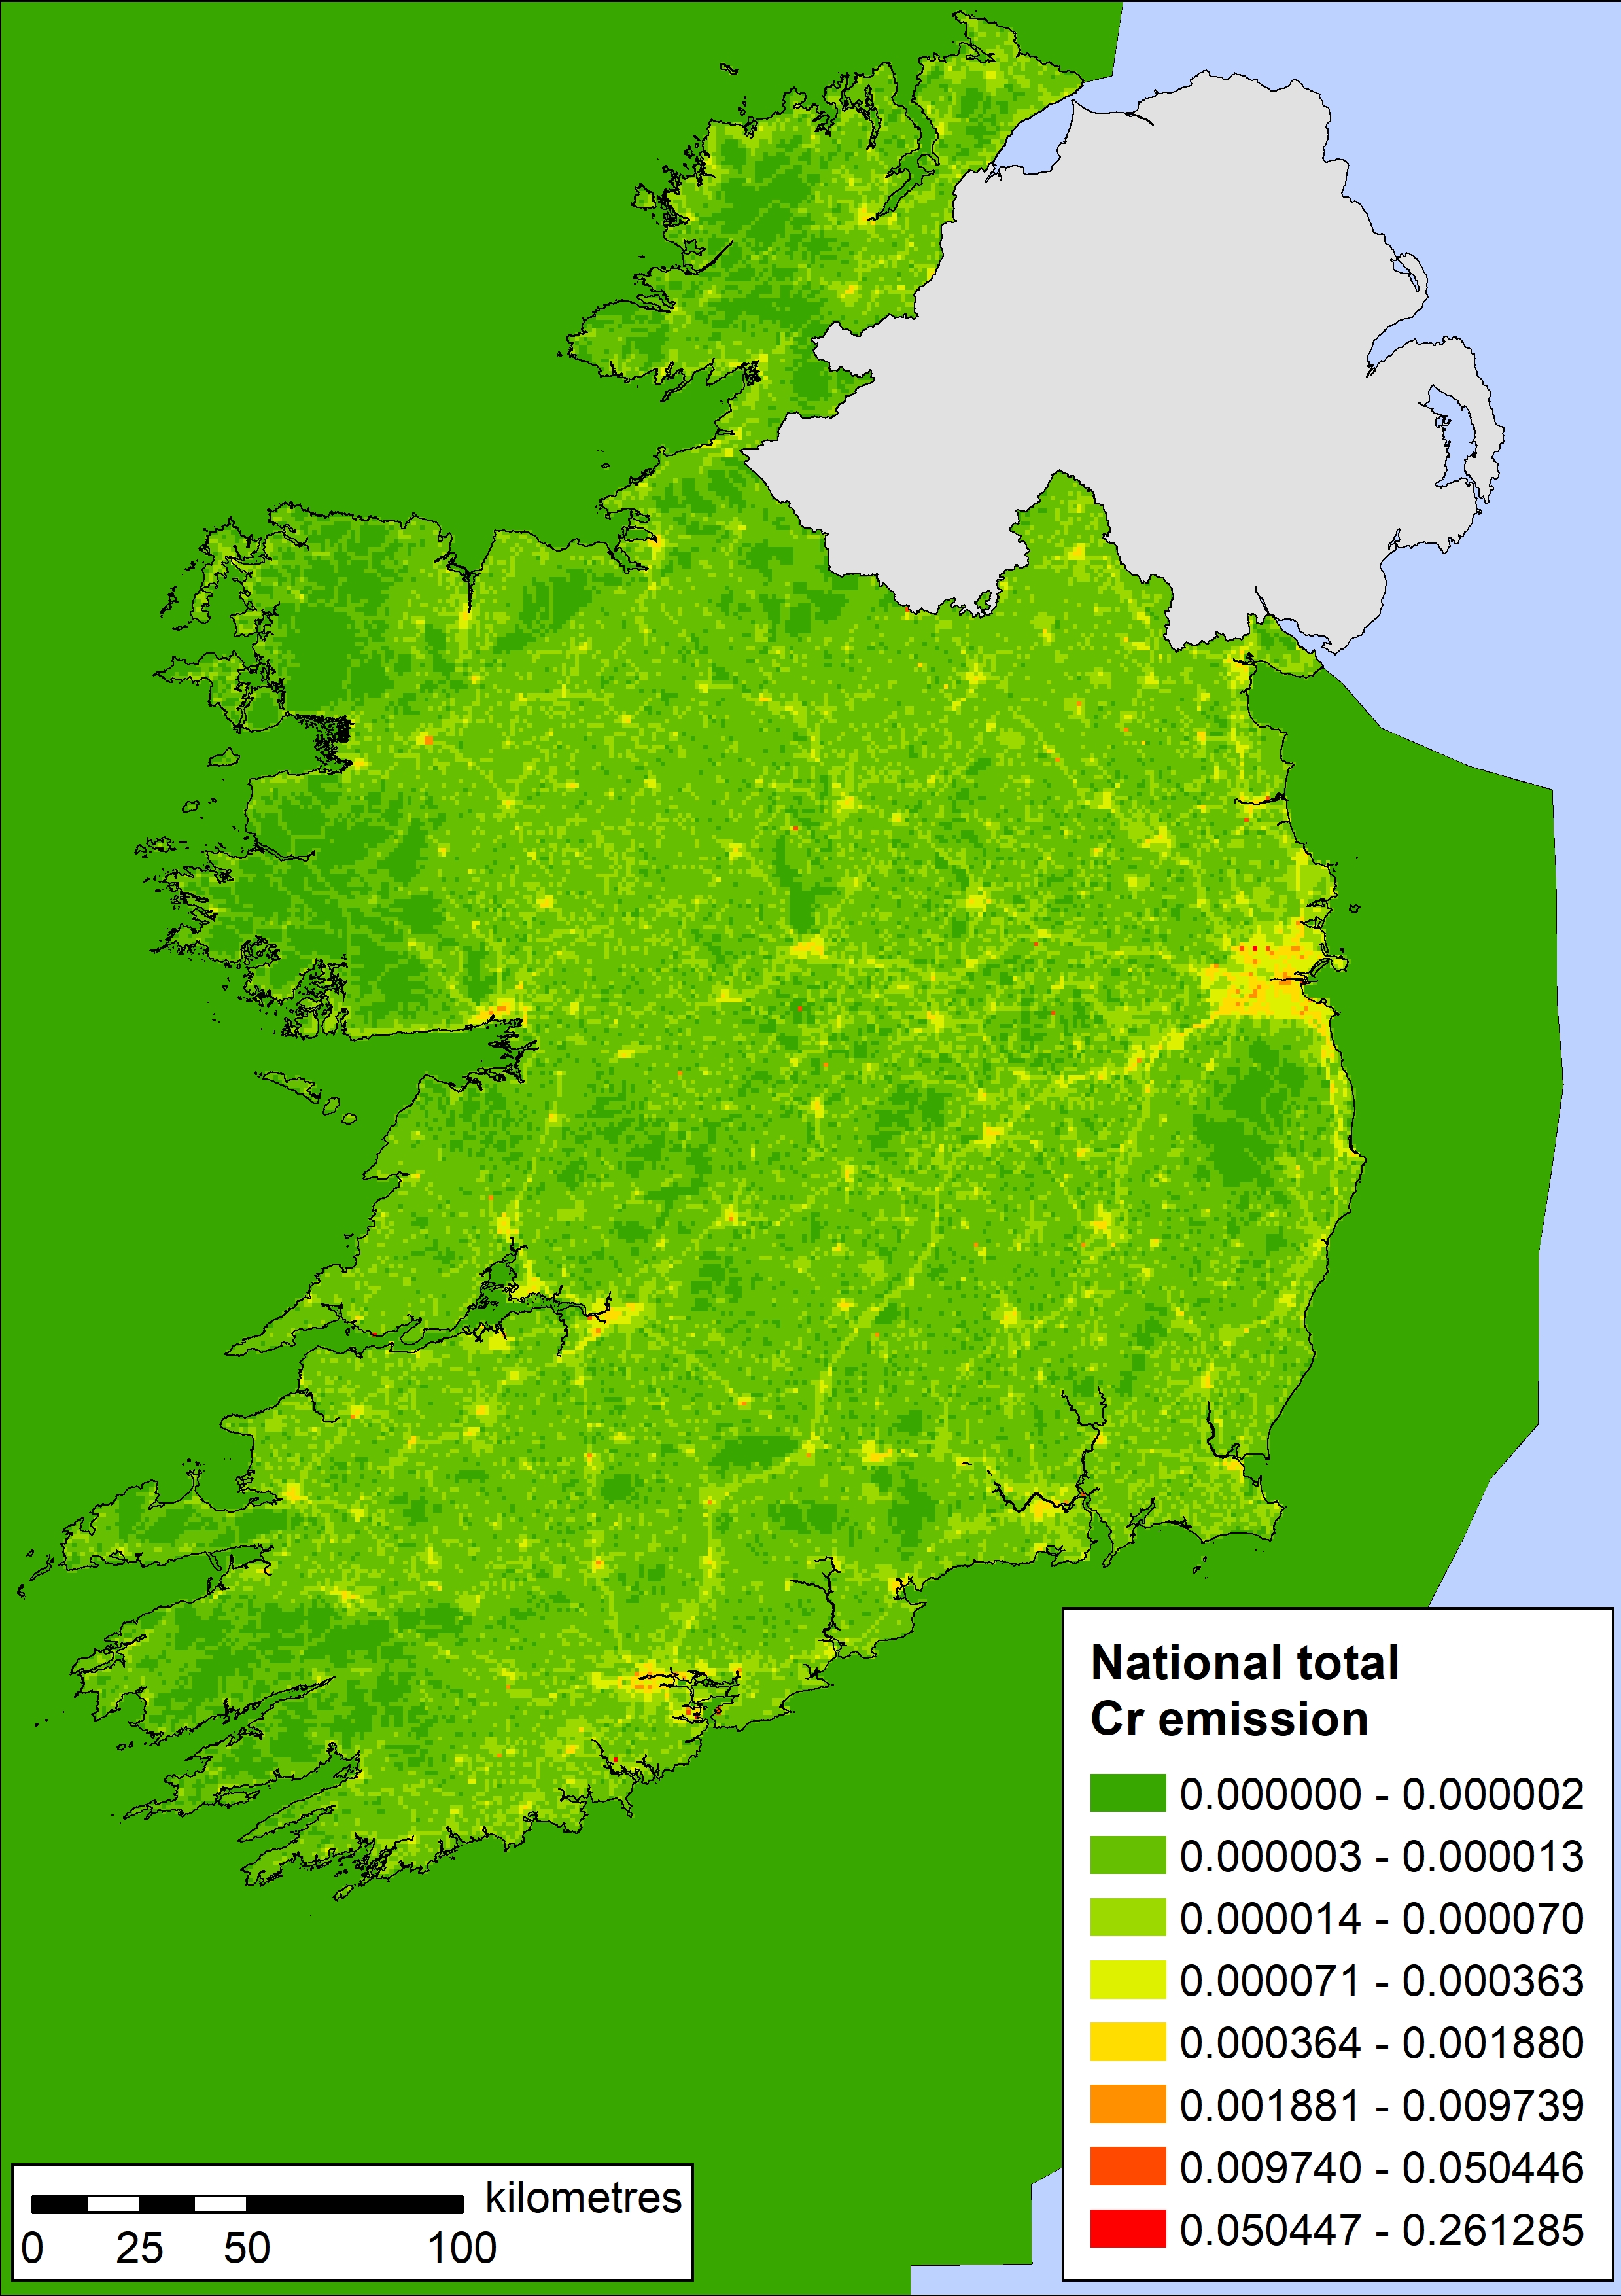
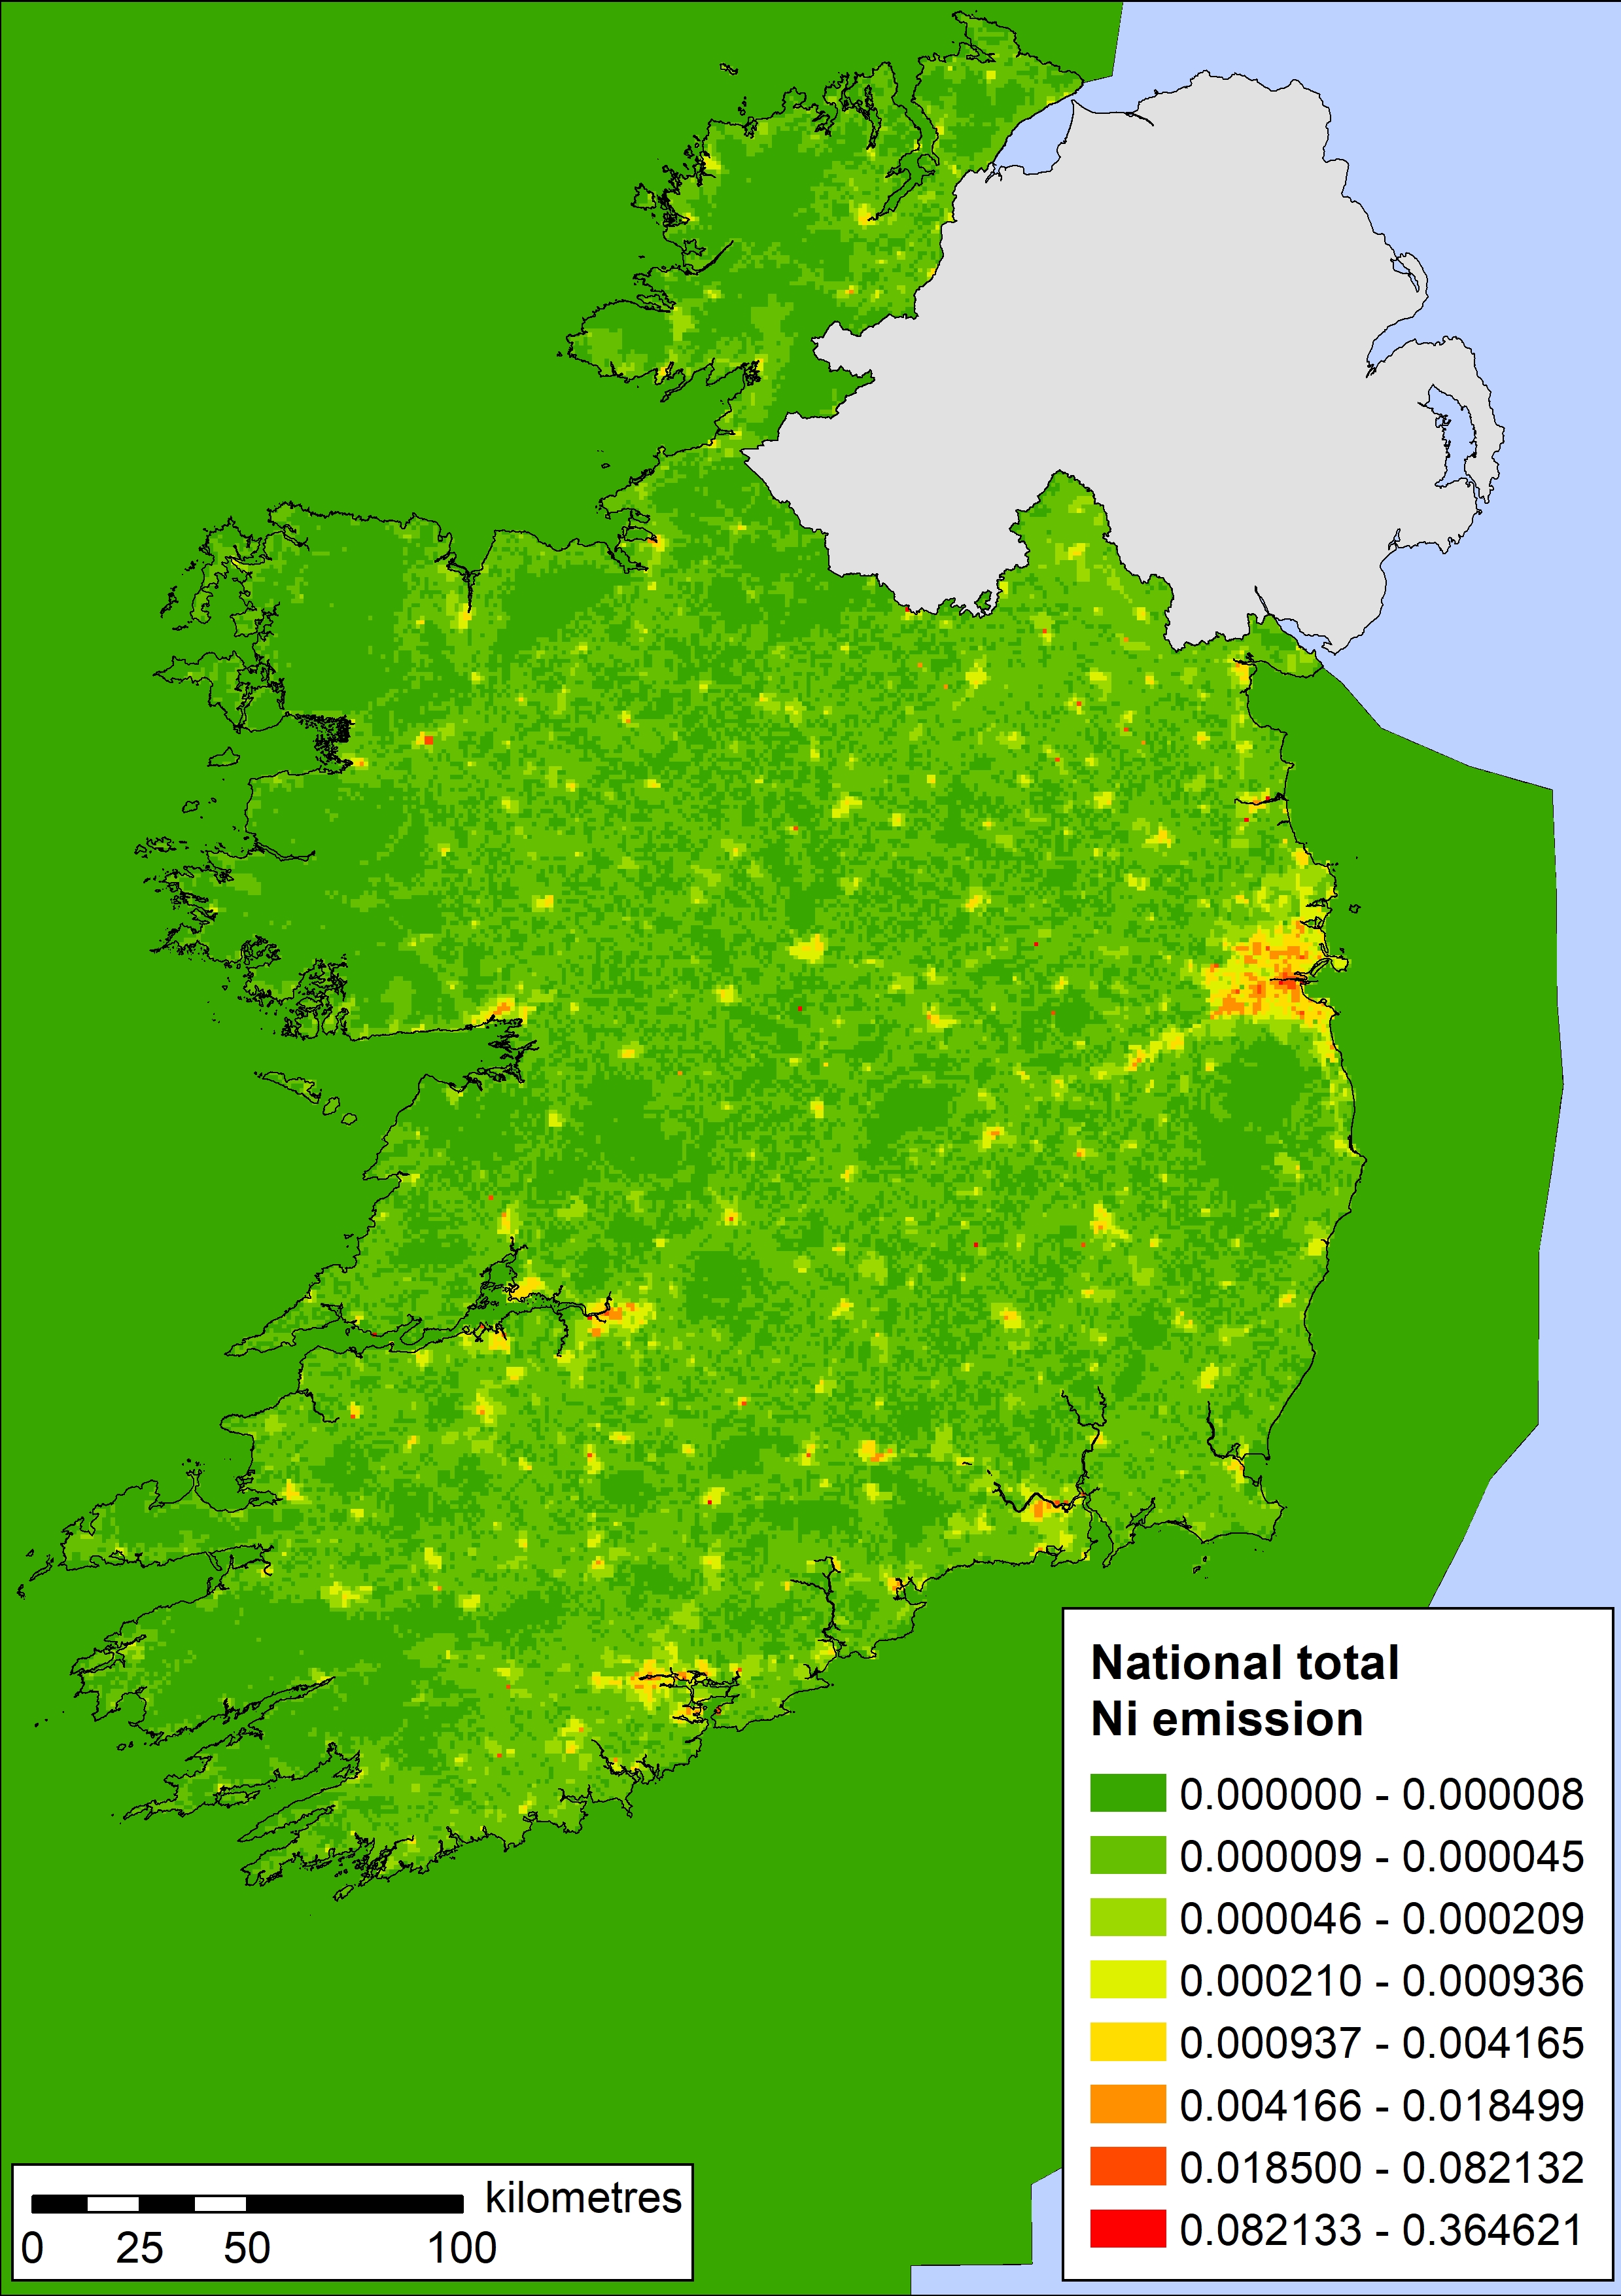
Pb, Cd, Hg, As, Cr, Cu, Ni, Se, Zn,
PCDD/PCDF (dioxins/furans), HCB, PCB,
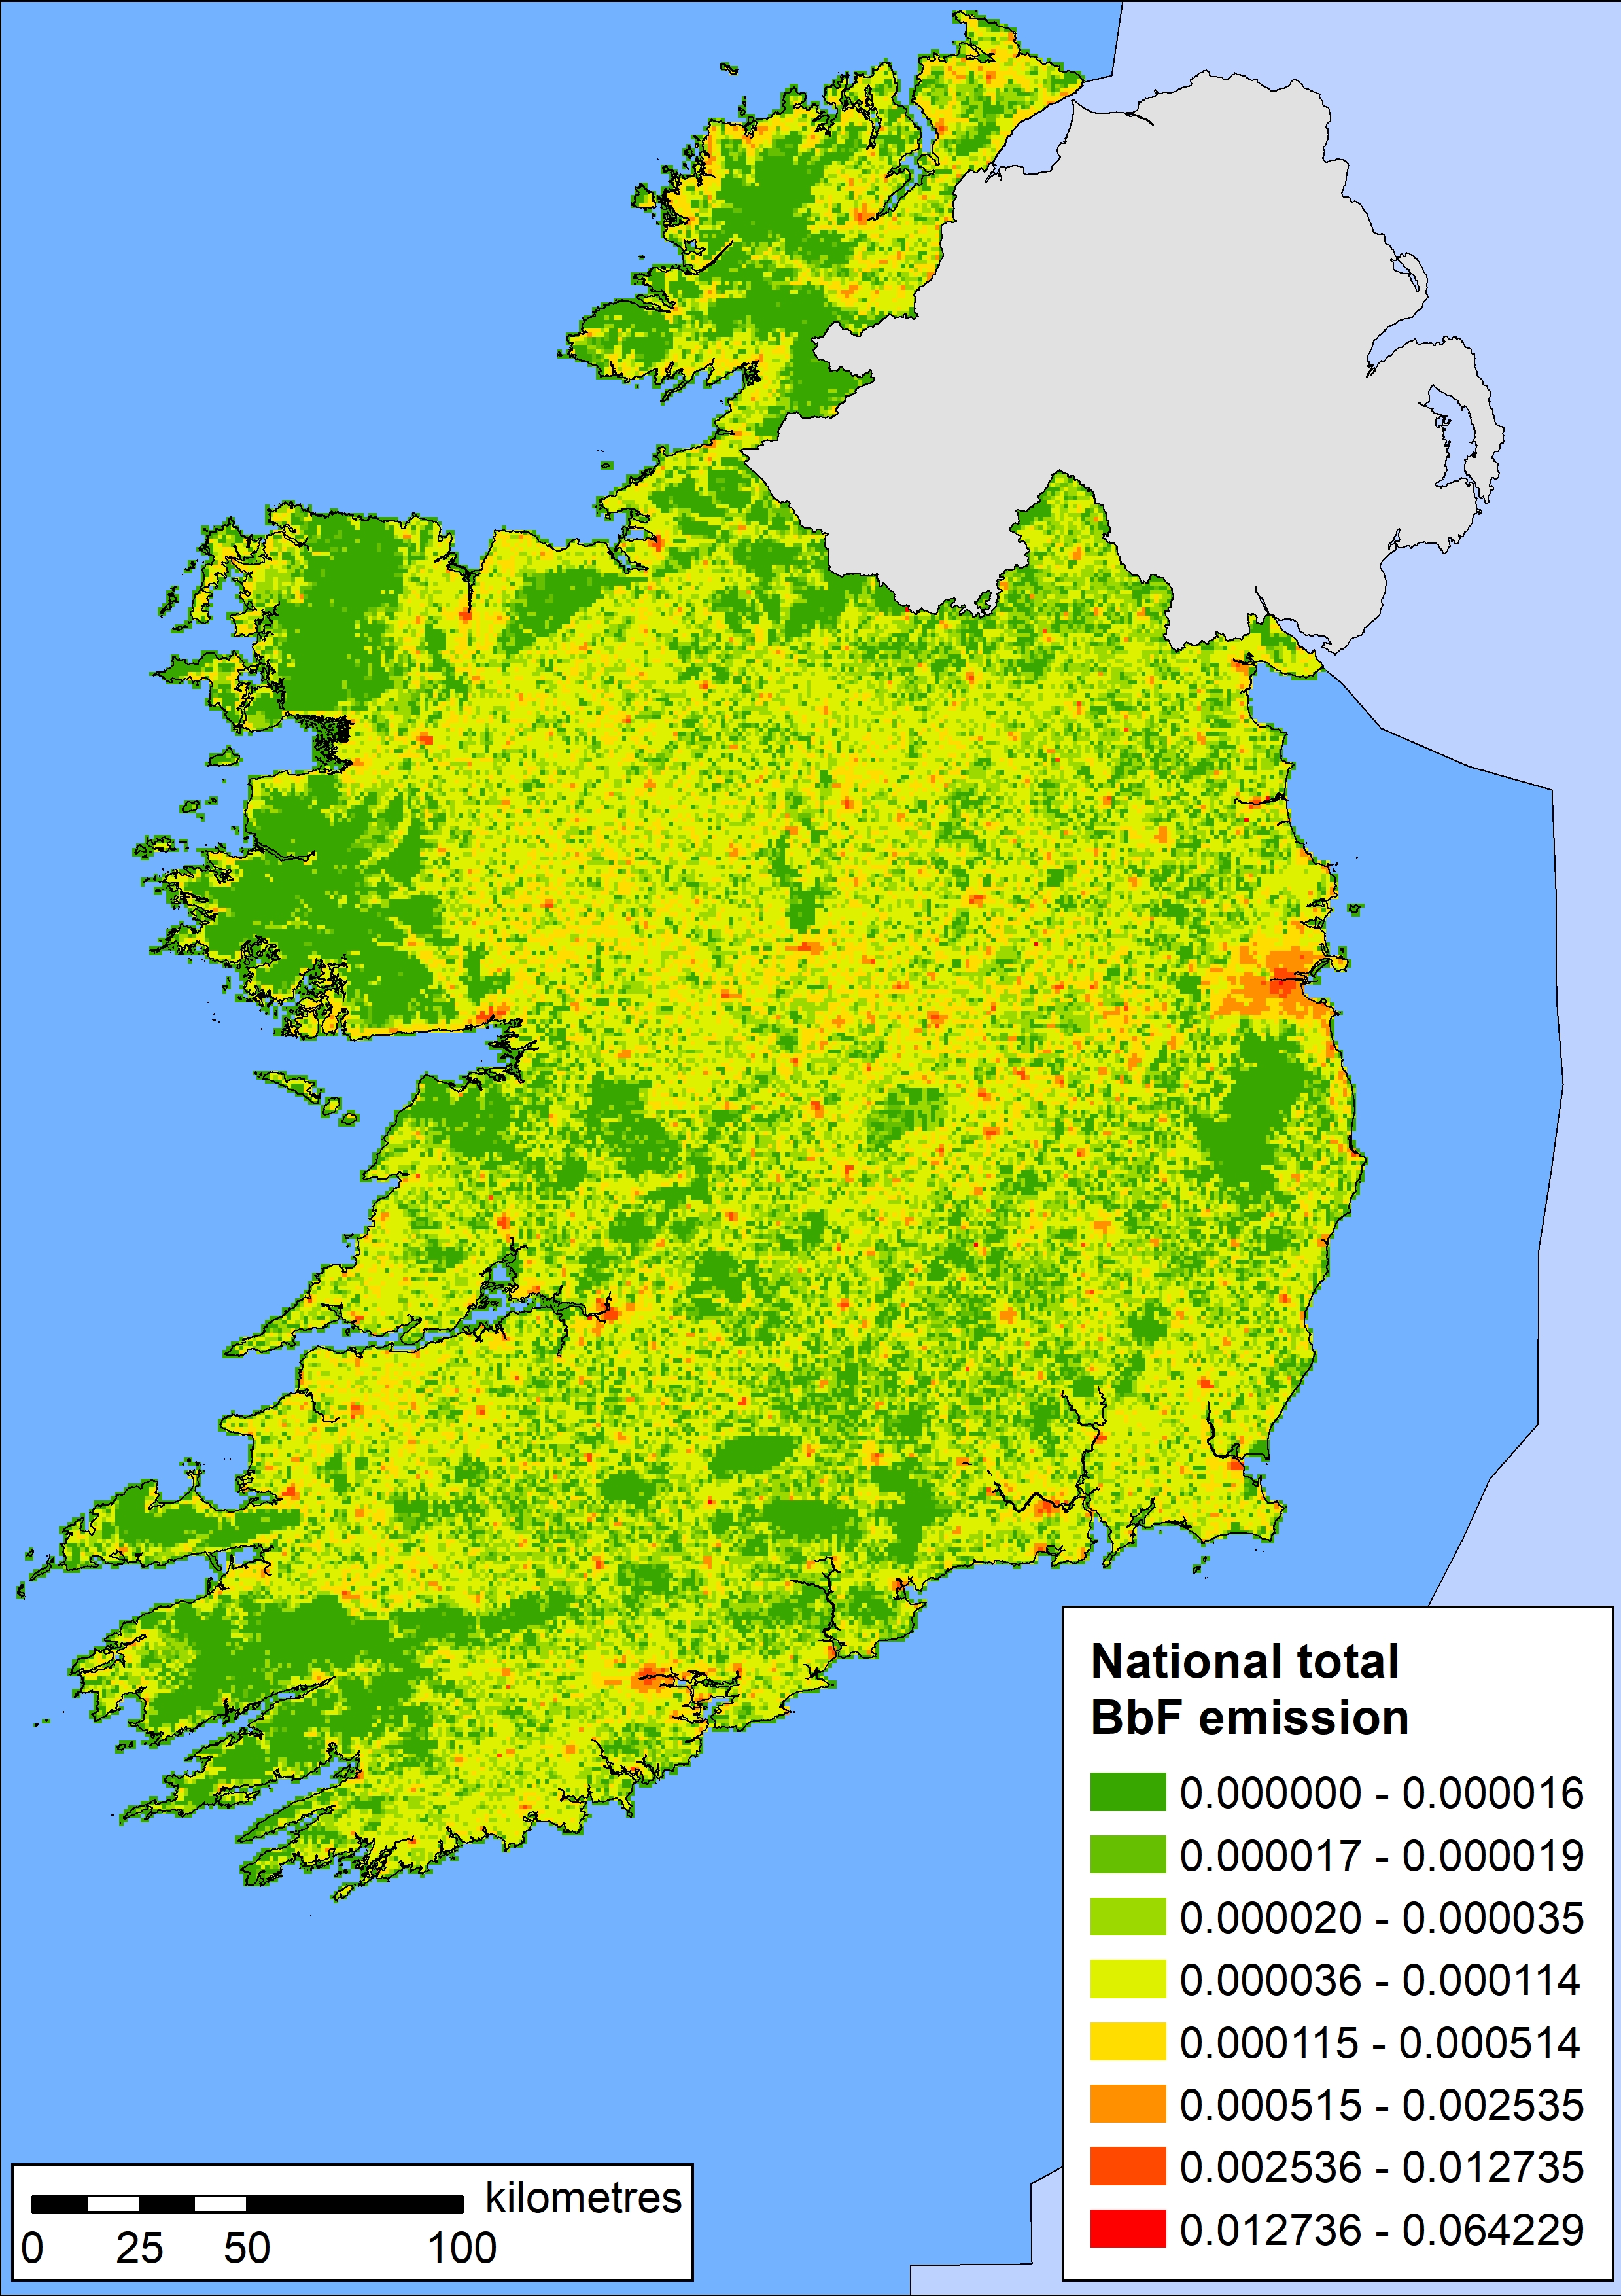
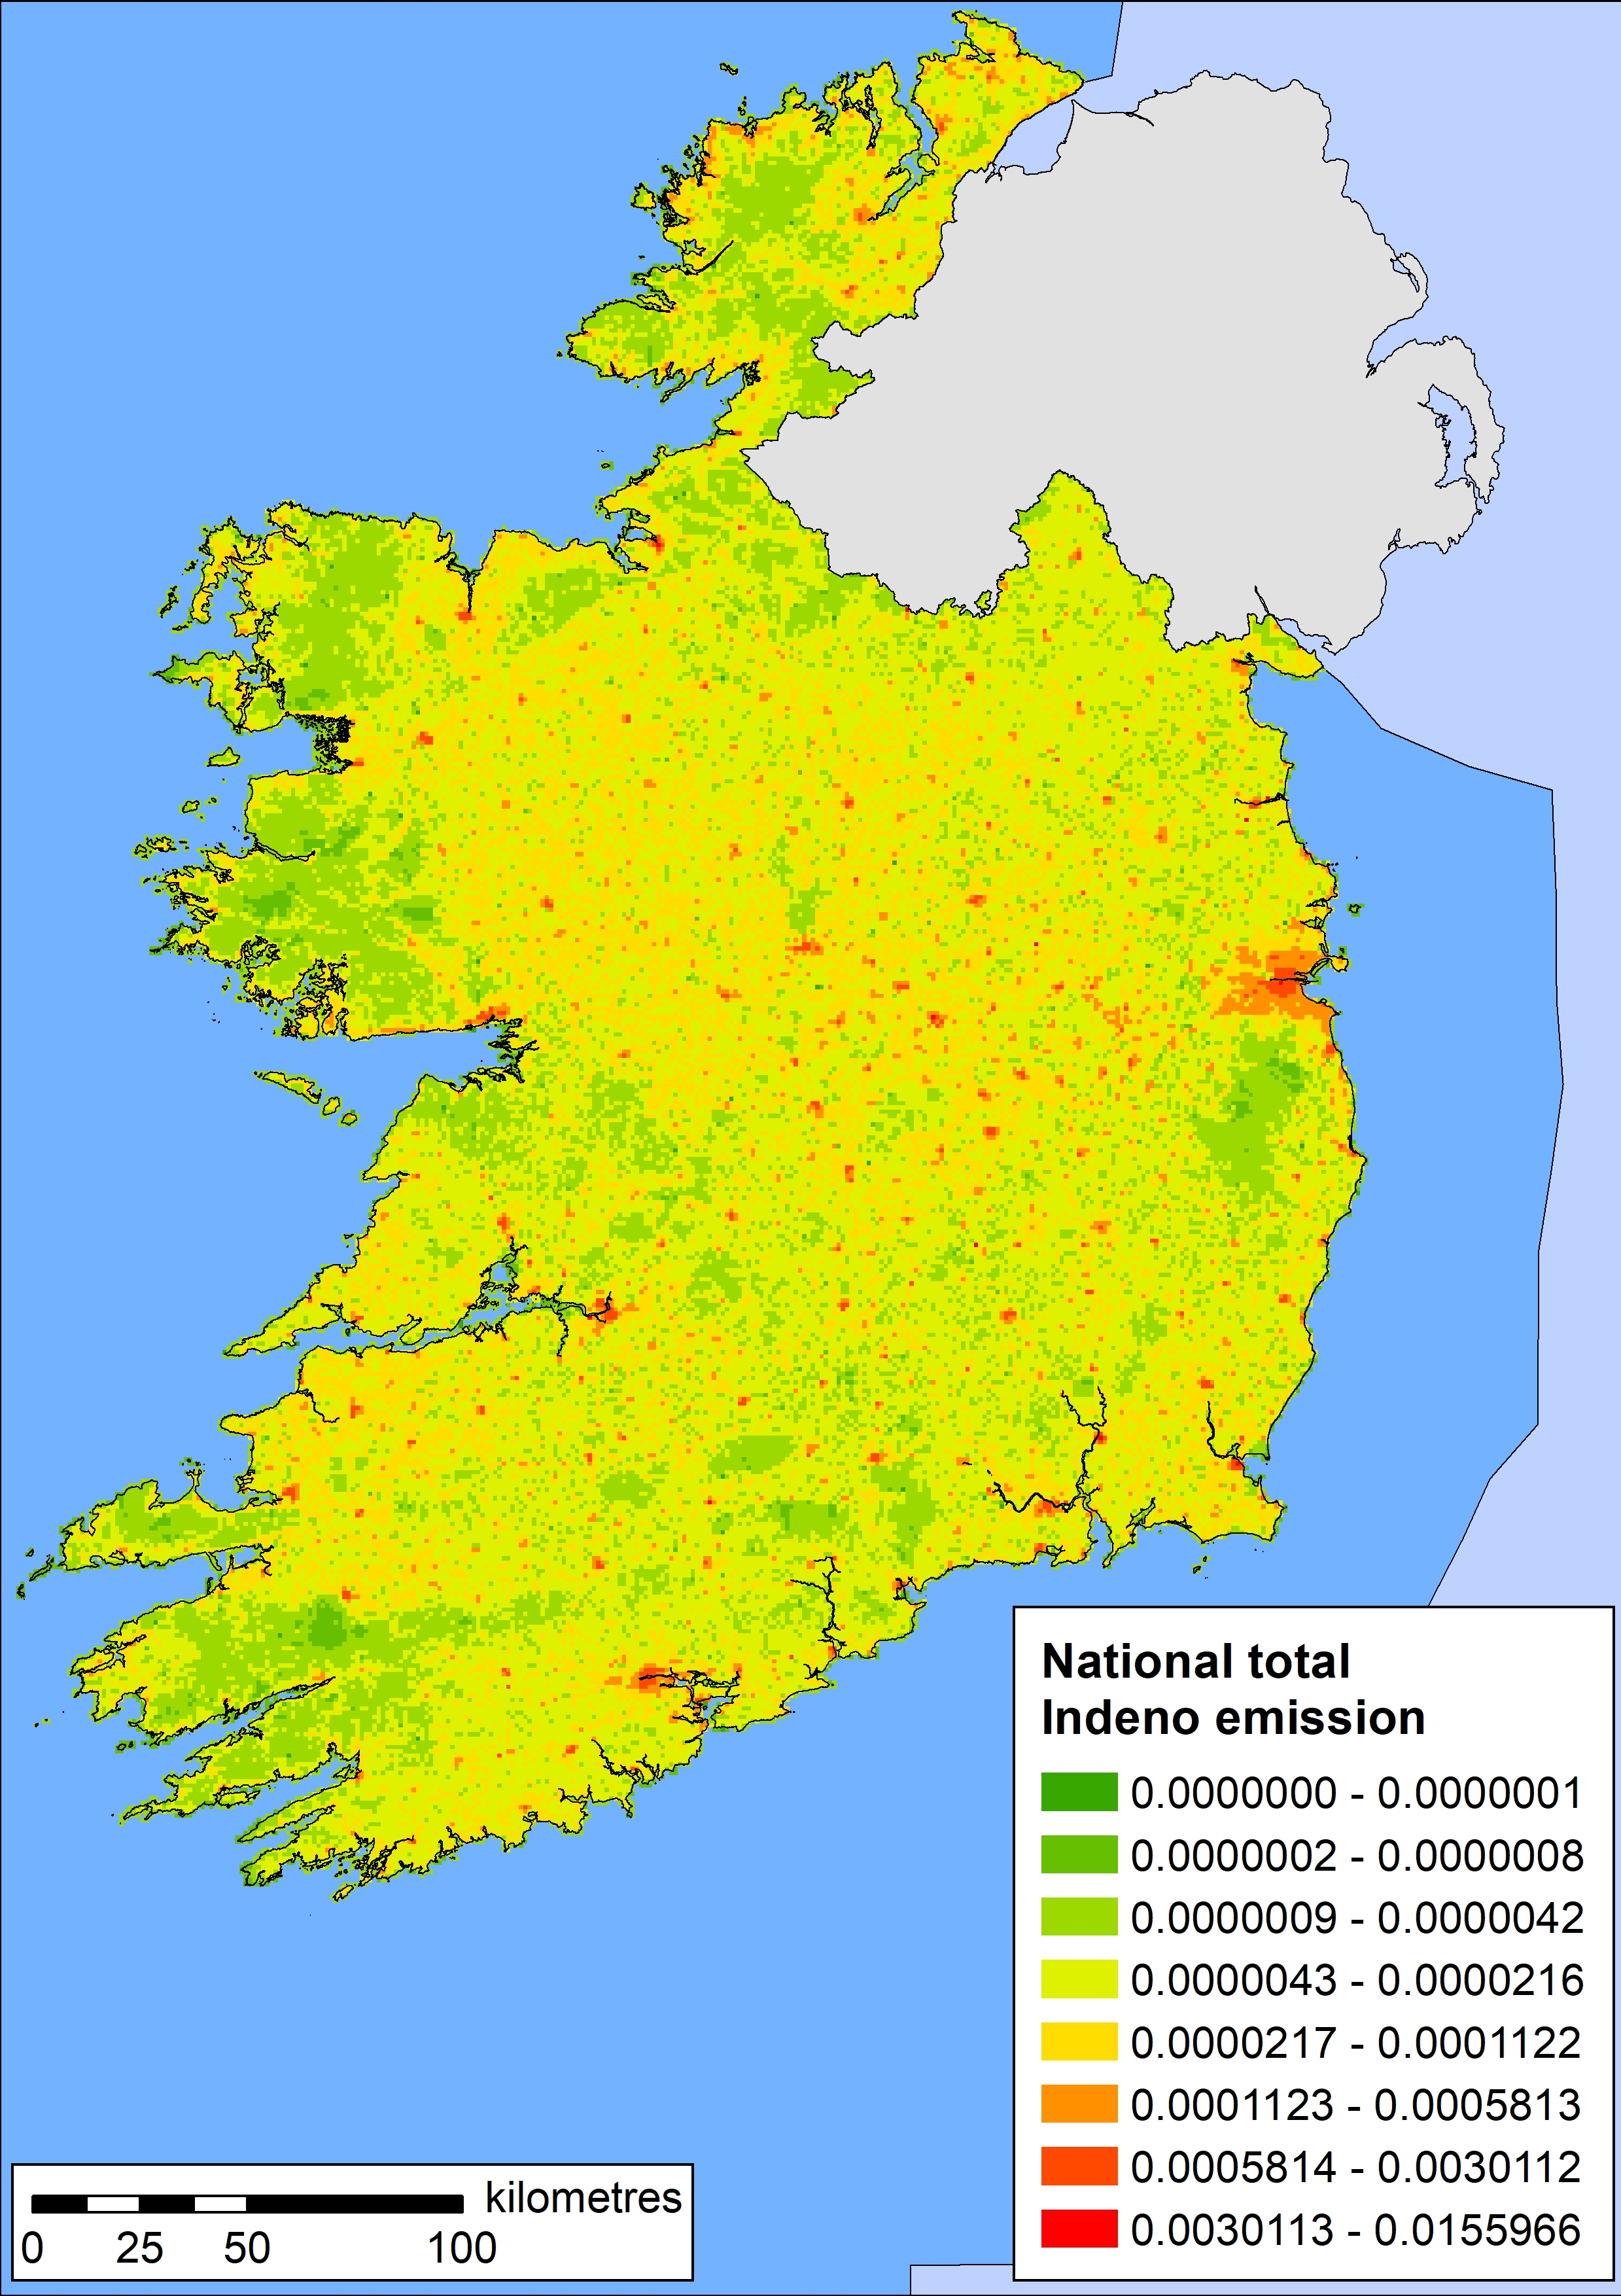
BaP (benzo(a)pyrene), BbF (benzo(b)fluoranthene), BkF (benzo(k)fluoranthene), Indeno (Indeno(1,2,3-cd)pyrene),
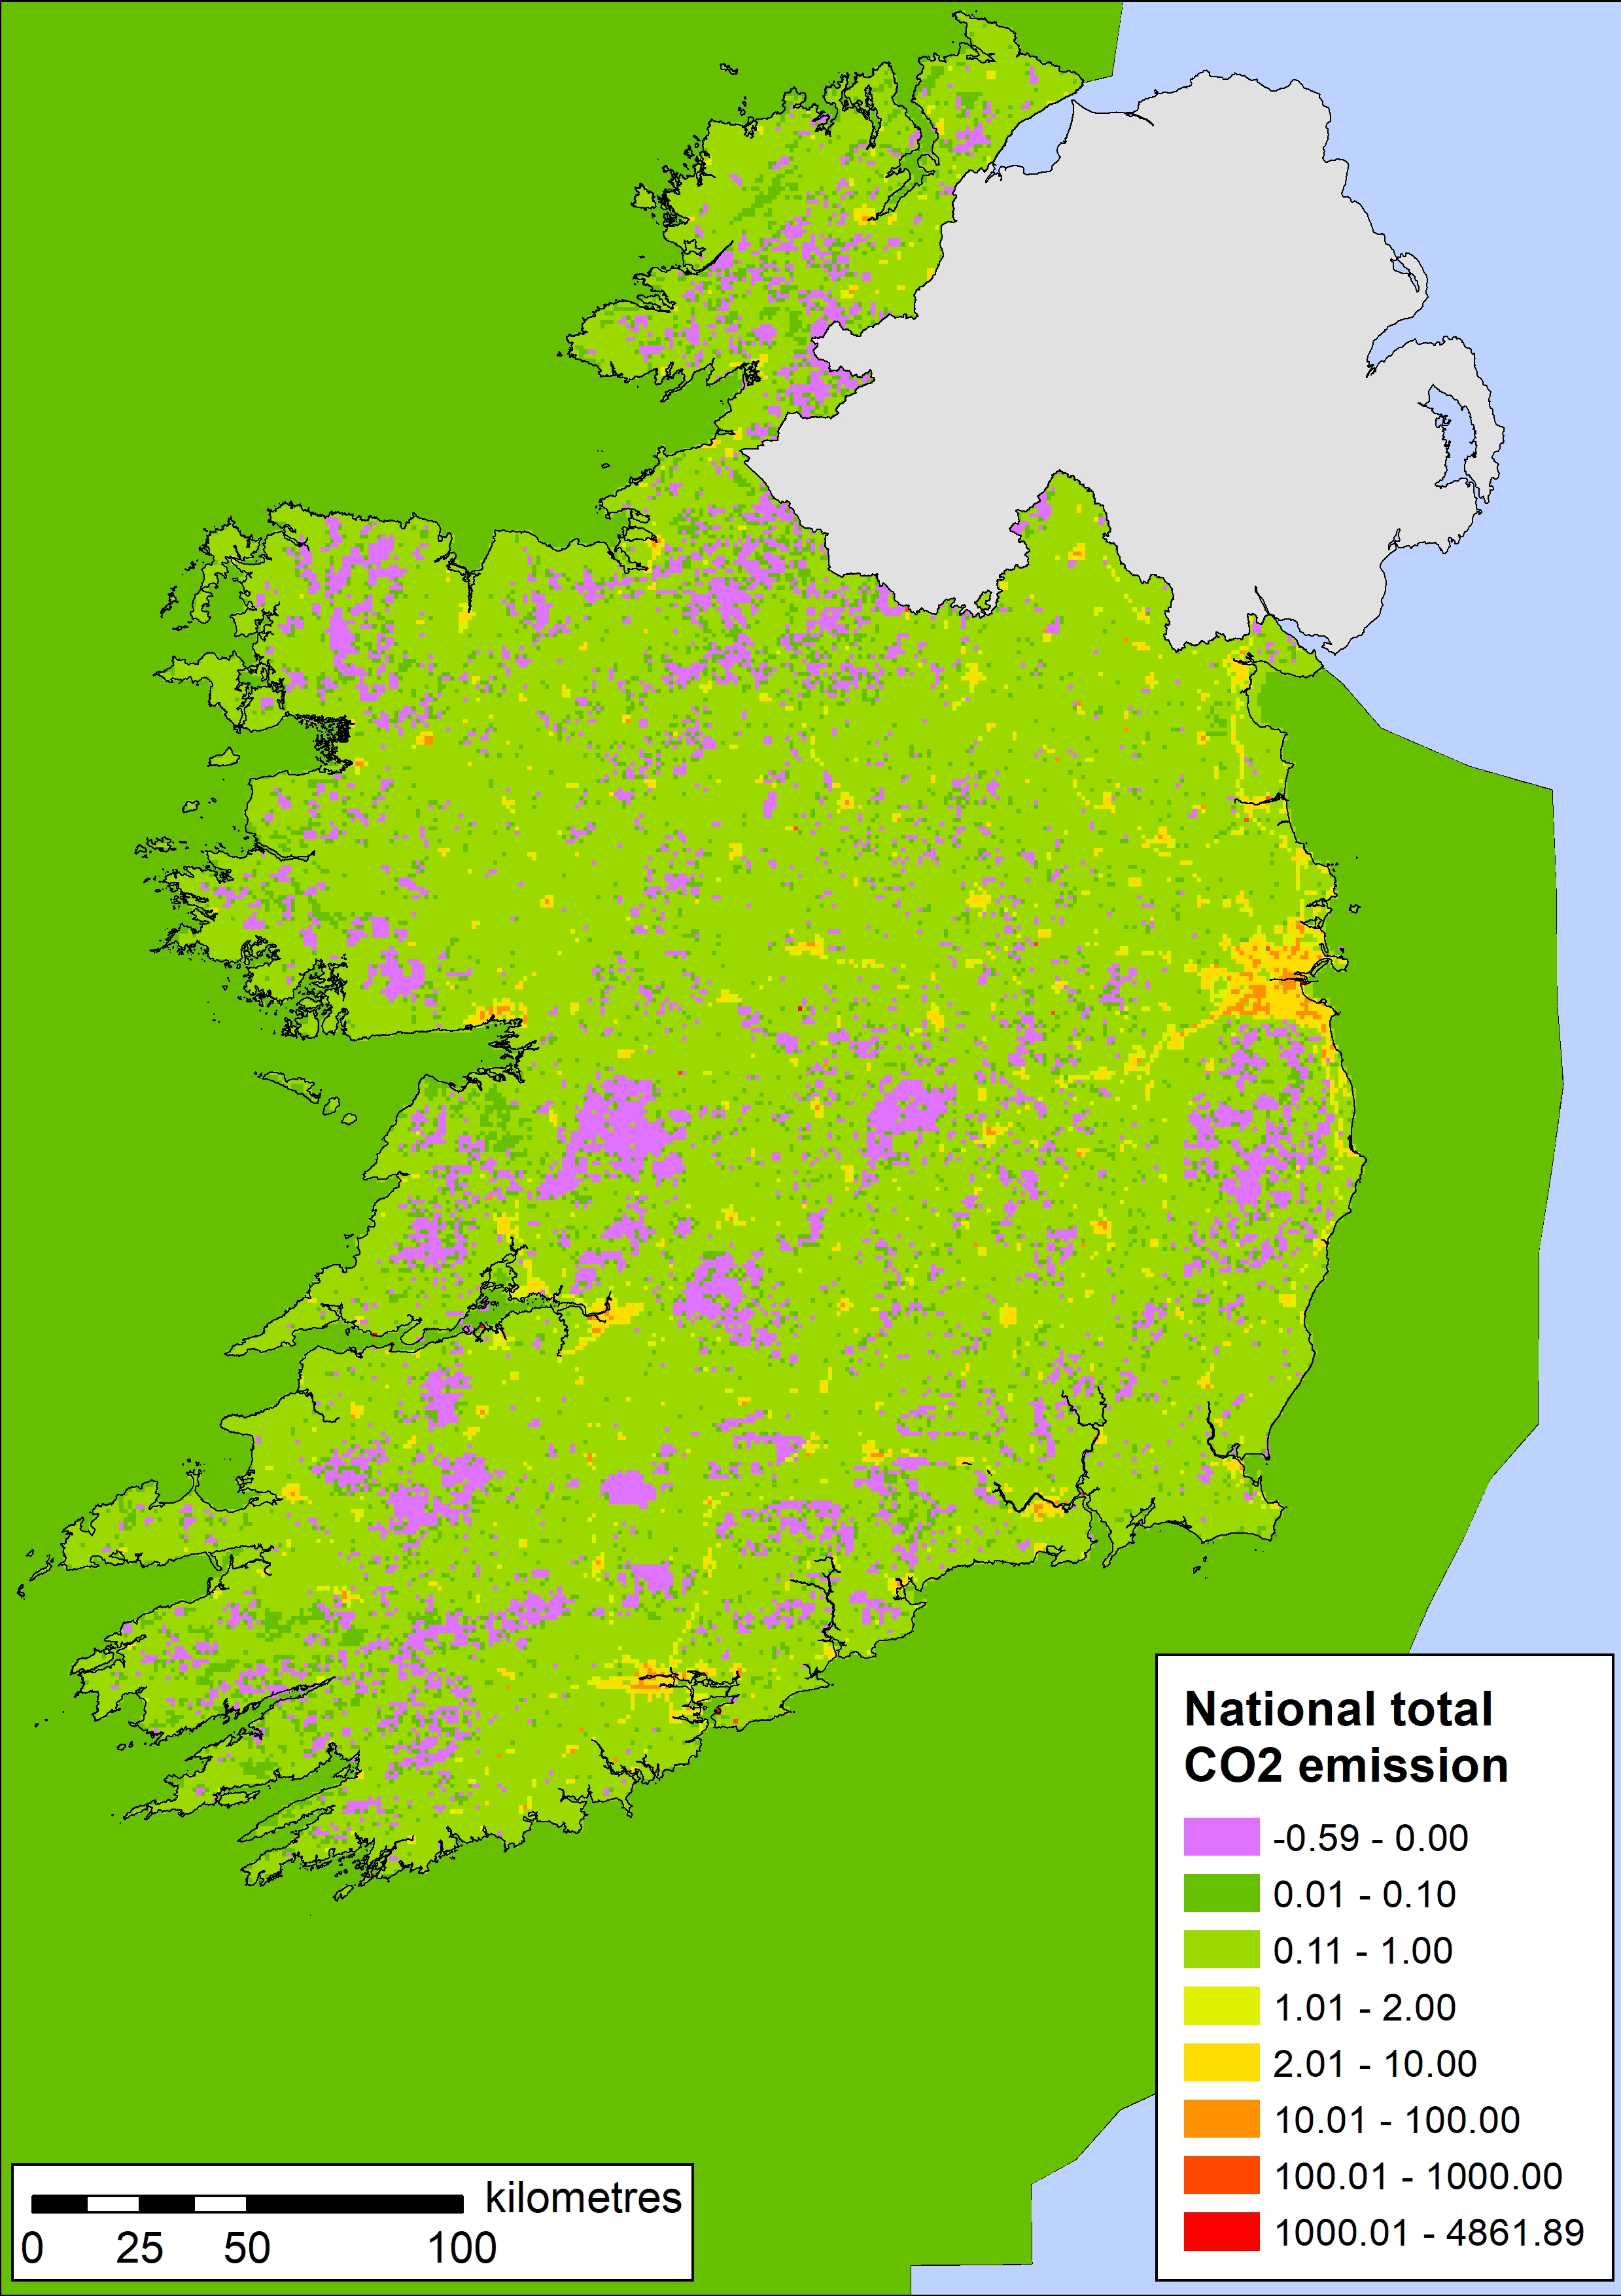
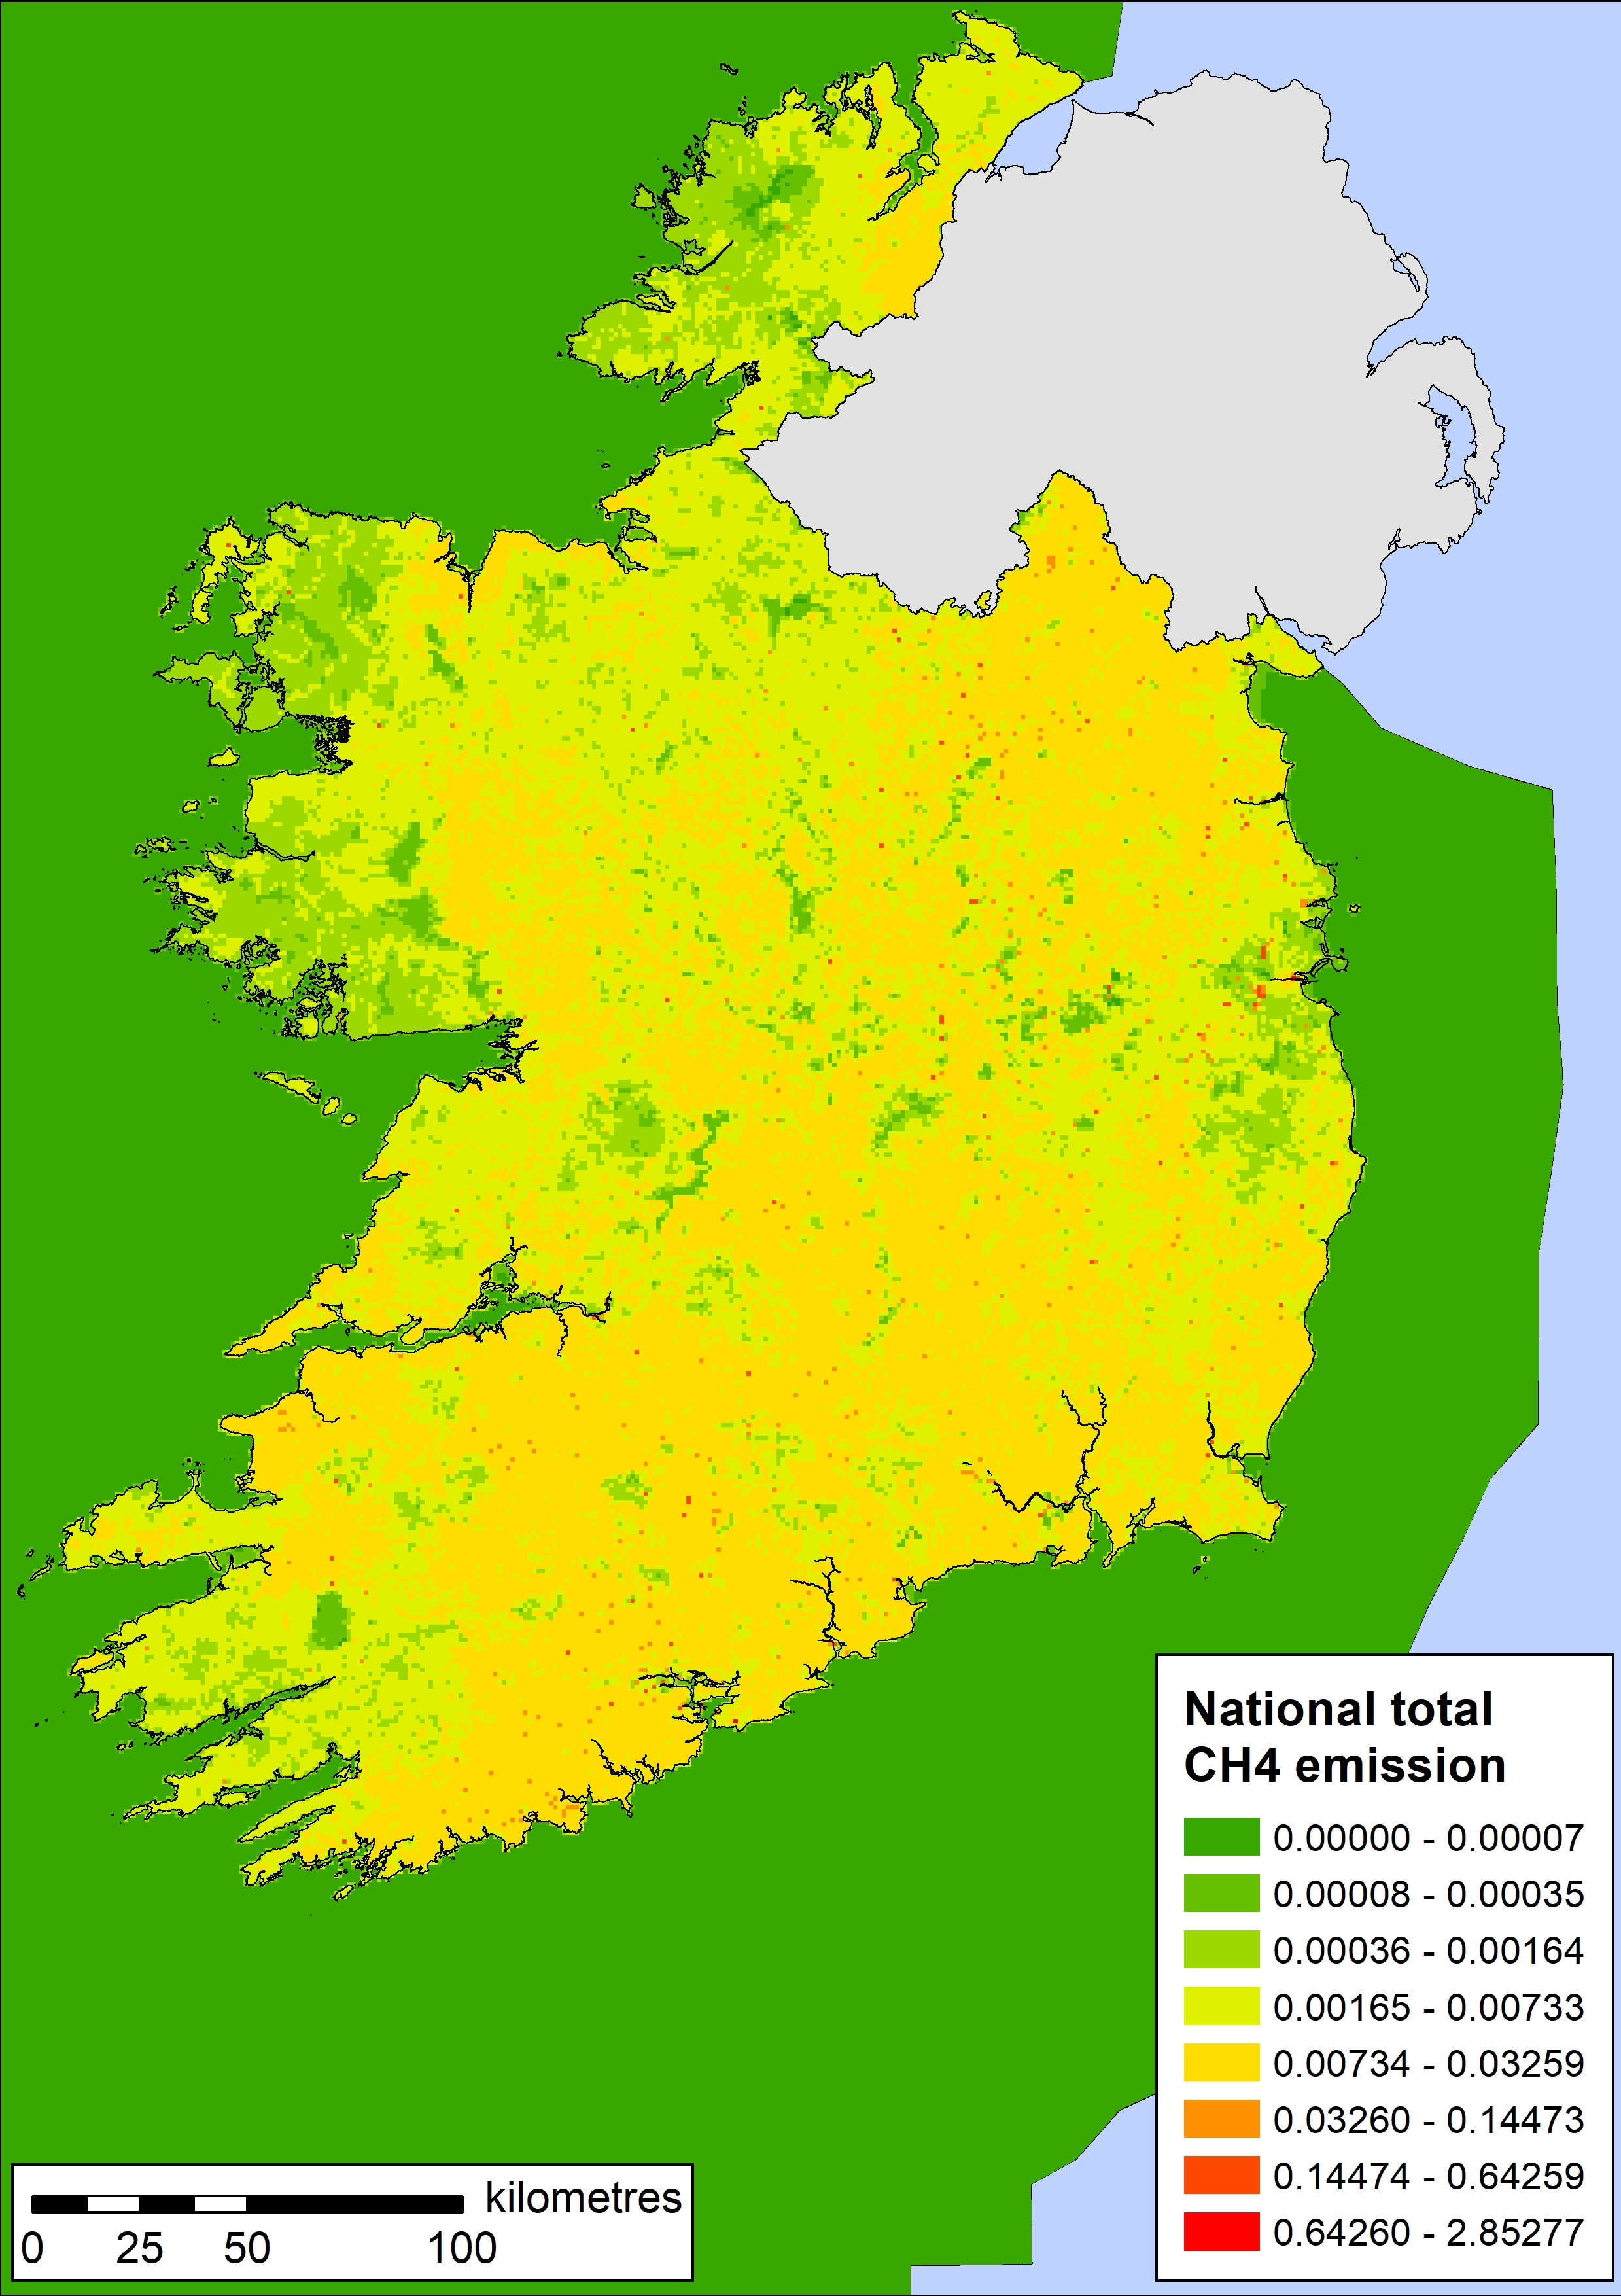
CO2, CH4, N2O, HFCs, PFCs, SF6, NF3
The shapefiles include emissions of all pollutants in the national inventory as national total, and for the individual GNFR sectors and for the LULUCF sector (GHG only).
Spatial emissions for 2019 are consistent with 2021 emission inventory reporting.
...
Spatial GHG emissions by local authorities (LA) are available for 2019. The emissions are consistent with the 2021 emission inventory. Emissions from international aviation and international navigation are not included in the CRF format and accordingly not in the GHG emissions by local authorities. Emissions allocated outside the area of the local authorities are not included in the dataset and following, the emissions total are not equal to the national total emissions for all GHG classes and pollutants. The largest sources outside the LA areas are national navigation and fishing.
Spatial GHG emissions by local authorities (LA)
...
Spatial emissions for 2016 are consistent with 2018 emission inventory reporting.
...
Spatial emissions for 2015 are consistent with 2017 emission inventory reporting.
